ShmoopTube
Where Monty Python meets your 10th grade teacher.
Search Thousands of Shmoop Videos
AP Statistics 2.1 Exploring Data 250 Views
Share It!
Description:
AP Statistics 2.1 Exploring Data. How does this change affect the mean, standard deviation, and IQR?
Transcript
- 00:04
And here's your shmoop du jour brought to you by pop quizzes the only [Boy blindfolded testing fizzy drinks]
- 00:07
real way to test whether someone knows their coke from their pepsi alright quiz
- 00:11
scores this quarter we're kind of low and your teacher decides to add five
- 00:15
points to everyone's individual quiz grades how does this change the mean,
- 00:19
standard deviation and interquartile range for the classes quiz scores. Huh,
Full Transcript
- 00:26
and here the potential answers....Okay this is a three-in-one deal pretty nice [Jacobs 3-in-1 coffee packet]
- 00:33
when opening a peanut but not nearly as exciting when in the form of a math
- 00:37
problem anyway let's just divide and conquer the first thing we need to [A knight wielding a sword]
- 00:41
figure out is how the mean will be affected if everyone score gets five
- 00:46
points tacked on to it plus reminder the mean is the same as the average so now
- 00:52
we're just adding five points to a score or two well the average would definitely [teacher marking papers]
- 00:57
be affected. But since every student is getting five bonus points across the
- 01:01
board the mean goes up by 5 too. Although if you ask us it's not much of a bonus if [Boy in a suit throwing cash into the air]
- 01:07
everyone gets one we don't want to raise, if everyone gets a raise like maybe
- 01:11
we're too competitive for our own good so yeah imagine three people get scores of one
- 01:15
two and three the mean of those scores is 1 + 2 + 3 divided by 3 or 2.. Add 5 to
- 01:22
each of those scores and we get six seven eight the mean of those scores is
- 01:26
six plus seven plus 8 divided by 3 or seven! exactly five higher alright well now that we've
- 01:31
confirmed that tid bit of information well looks like we can kick answers D
- 01:35
and E to the curb we're asked next about that standard deviation but before we [magnifying glass inspecting the question]
- 01:40
start whipping out a formula or two let's think about this for a skinny
- 01:43
minute the standard deviation is about how spread out the data are from each [example of a standard deviation formula]
- 01:48
other well since each score is being affected in exactly the same way plus [teacher throws number into the air]
- 01:53
five to each the scores aren't any further apart from each other than
- 01:57
before so the standard deviation will stay the same kind of likes Beyonce [Two beyonces wearing sparkling dresses]
- 02:02
seriously she hasn't changed in 15 years what is her secret? Now the only one of
- 02:07
our three remaining choices that shows a standard
- 02:09
deviation remaining the same is answer C so it looks like that's our horse but [A horse sniggering]
- 02:14
let's double check the interquartile range too just to be sure. Well to find
- 02:18
the interquartile range we have to subtract the value of Q 1 the first
- 02:22
quartile from q3 the third quartile well since both of these scores will have had [Q1 substracted from Q3 value]
- 02:28
five points added to them we're going to subtract five from five and those new
- 02:33
points are going to cancel out completely meaning the interquartile
- 02:37
range won't change a lick either which is still in line with option C and [Option C ticked green]
- 02:41
that's going to be our answer whoa, we've got another three in one who exactly his
- 02:45
growing these mutant peanuts [Man with 3 heads growing peanuts]
Up Next
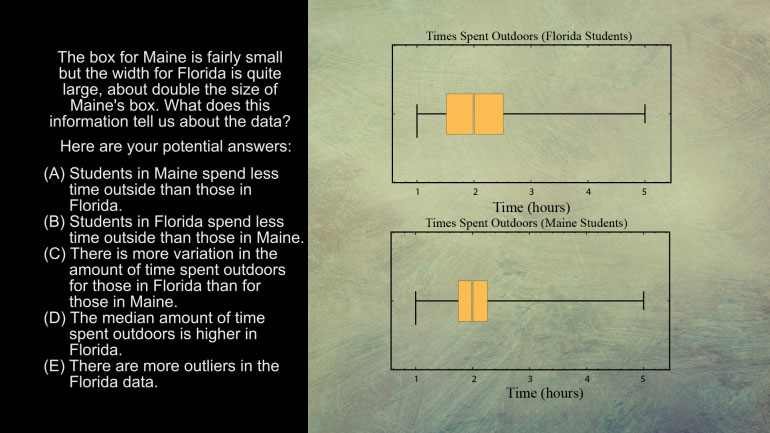
AP Statistics 5.1 Exploring Data. What does this information tell us about the data?
Related Videos
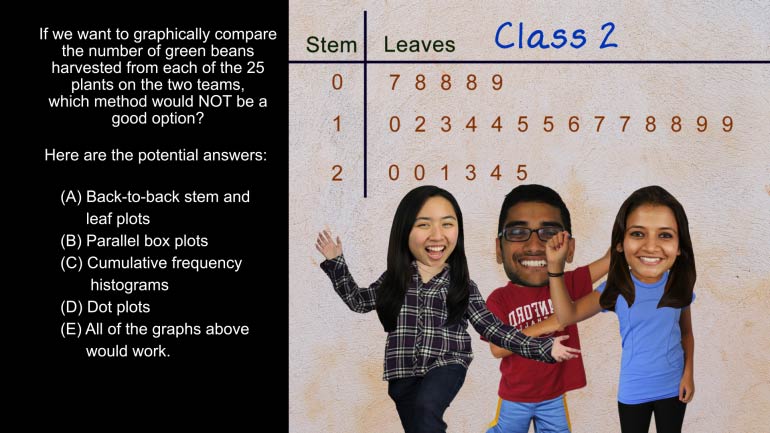
AP Statistics 5.2 Exploring Data. Which method would not be a good option?
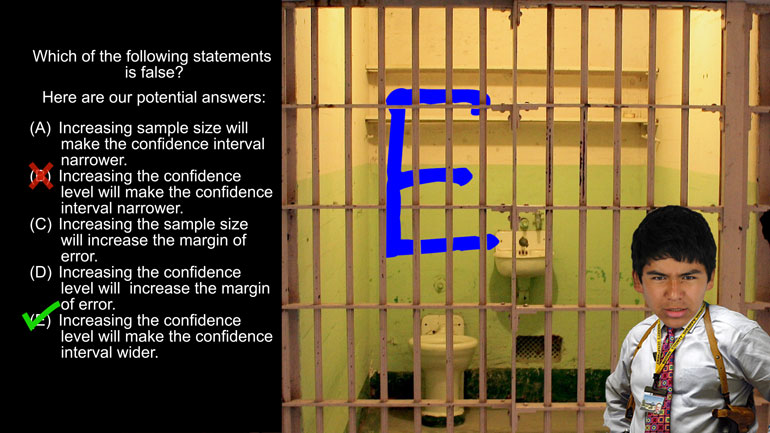
AP Statistics 1.5 Statistical Inference. Which of the following statements is false?

Want to pull an Oliver Twist and ask us for more? We've gotcha covered. Head over to /video/subjects/math/test-prep/ap-statistics/ for more AP...
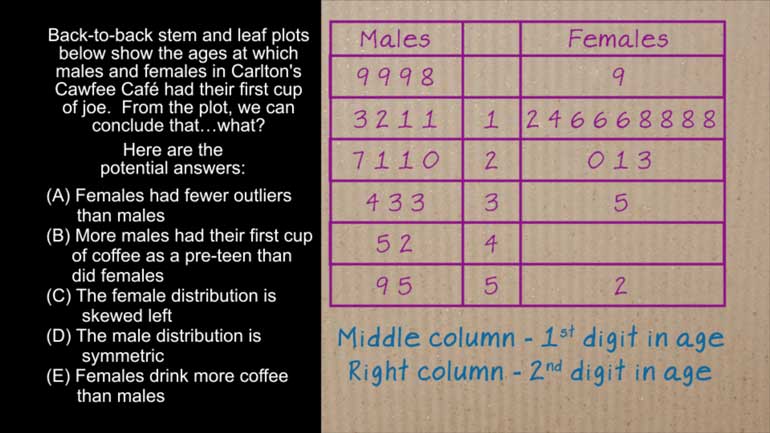
AP Statistics 4.5 Exploring Data. What can we conclude from the plot?