ShmoopTube
Where Monty Python meets your 10th grade teacher.
Search Thousands of Shmoop Videos
AP Statistics 5.2 Exploring Data 49 Views
Share It!
Description:
AP Statistics 5.2 Exploring Data. Which method would not be a good option?
Transcript
- 00:00
Thank you We sneak And here's your shmoop du jour
- 00:05
brought to you by green bean casserole which proves that
- 00:09
calling something a casserole doesn't necessarily make it delicious to
- 00:15
science Classes are growing green beans and the school garden
- 00:18
Each team has about twenty five plants The team that
Full Transcript
- 00:20
harvest the most green beans gets the ultimate prize Mr
- 00:23
falcons Famous green bean casserole if we wanna graphically compare
- 00:28
the number of green beans harvested from each of the
- 00:30
twenty five plans on the two teams Which method would
- 00:33
not be a good option And here the potential answers
- 00:38
Okay that big knot in all caps will jump out
- 00:42
at us here We think we know karate but yeah
- 00:45
this question wants to know which option won't work So
- 00:47
let's keep that money Many a speed reader is felled
- 00:50
A problem like this in the past Could we use
- 00:52
a back to back stem and leaf plots Well what
- 00:55
did that look like Like this Basically and yeah that
- 00:58
would totally work We'd show the results of one team
- 01:01
on one side and the results of the second team
- 01:04
on the other unless one team is using based hand
- 01:06
and the other team is using based aid we don't
- 01:08
see any reason you couldn't go this route But what
- 01:10
about be parallel box plots Sure if we went in
- 01:14
that direction we'd wind up with something Looks like this
- 01:17
one box blocked for team numero uno and another one
- 01:20
here for team knew marot dose pretty easy toe eyeball
- 01:23
these two and no similarities and differences between him like
- 01:27
uh this one is obviously a libera While weather has
- 01:29
more gemini tendency about dot plots Yep those are all
- 01:34
viable options as well And would look like this and
- 01:38
a cumulative frequency hissed a gram Sorry pal we can't
- 01:42
use this type of graft show data about each individual
- 01:45
green being planned on two separate teams It just doesn't
- 01:48
work that way Why might as well ask why is
- 01:51
the sky blue or why raw green beans so foul
- 01:55
tasting yeah see is our answer We're still not sure
- 01:59
whether winning the green bean casserole thing is good or
- 02:02
bad but we might prefer to be the runner up 00:02:04.749 --> [endTime] in this one Yeah definitely runner up
Up Next
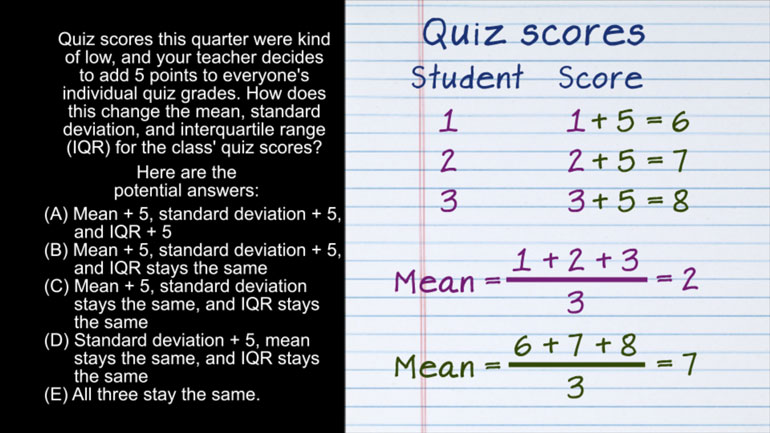
AP Statistics 2.1 Exploring Data. How does this change affect the mean, standard deviation, and IQR?
Related Videos
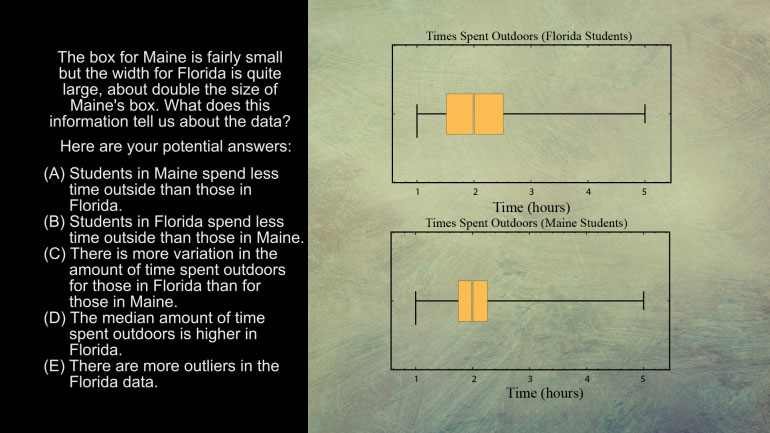
AP Statistics 5.1 Exploring Data. What does this information tell us about the data?
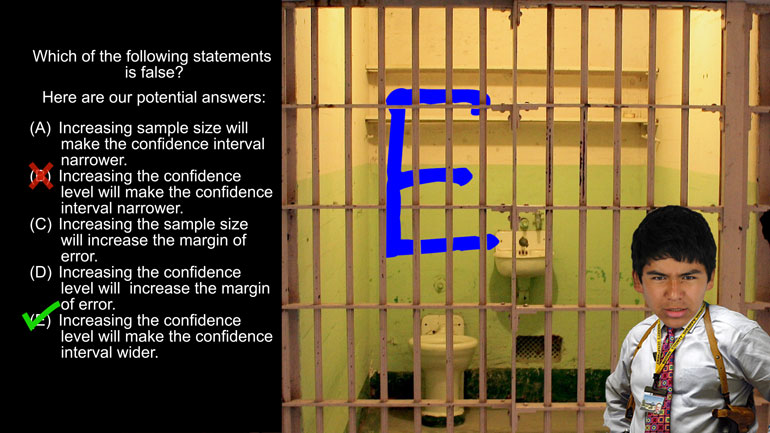
AP Statistics 1.5 Statistical Inference. Which of the following statements is false?

Want to pull an Oliver Twist and ask us for more? We've gotcha covered. Head over to /video/subjects/math/test-prep/ap-statistics/ for more AP...
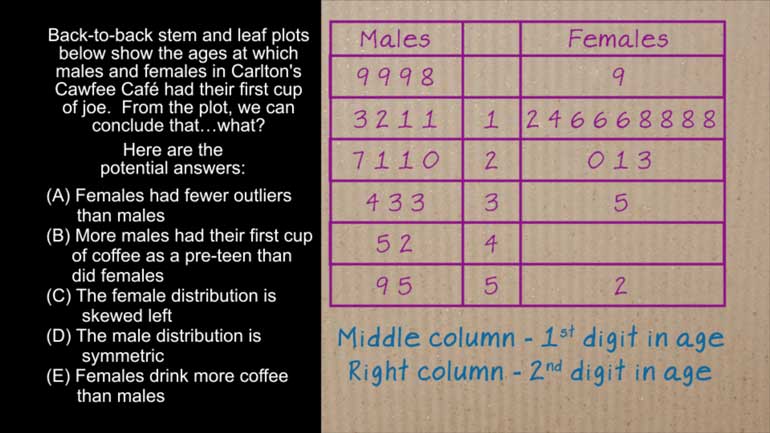
AP Statistics 4.5 Exploring Data. What can we conclude from the plot?