ShmoopTube
Where Monty Python meets your 10th grade teacher.
Search Thousands of Shmoop Videos
AP Statistics 5.1 Exploring Data 61 Views
Share It!
Description:
AP Statistics 5.1 Exploring Data. What does this information tell us about the data?
Transcript
- 00:04
And here's your shmoop du' jour brought to you by the state of
- 00:06
Maine. Where every street is a maine street..we drew two box plots to compare [Car appears and beeps on main street]
- 00:13
the amount of time spent outdoors in the summer for high school students in Maine
- 00:16
versus high school students in florida. The box for Maine is fairly small but the width for
- 00:21
Florida is quite large about double the size of Maine's box.. What is this
Full Transcript
- 00:25
information tell us about the data and here's potential answers [mumbling]
- 00:31
All right, let's be real Maine isn't one of the top party states, there [Tumbleweed rolls through Maine Street]
- 00:37
aren't a heck of a lot of fraternities that closed up shop during spring break
- 00:39
and hightail it to Augusta. That said summers in Maine aren't awful they're
- 00:44
just not as popular as Florida's but er, what is the wider box plot for Florida [Box plot for Florida students]
- 00:49
tell us exactly does it tell us that A students in Maine spend less time
- 00:53
outside than those in Florida well that may be true we can't tell for sure with [Boy with his arms up confused]
- 00:58
the information we've got the box plots width doesn't tell us anything about the
- 01:02
amount of time it's just given us an idea of the range of data although if [Lots of big data signs piled on to each other]
- 01:07
you're from Florida we wouldn't be surprised if you got that wrong. got [two guys on a beach in Florida]
- 01:10
a lot of partying to do. What about B students in Florida spend less time
- 01:14
outside than those in Maine certainly not case in point is the median amount
- 01:19
of time spent outdoors higher in Florida no clue we're not given any actual [Answer D with a big red cross through]
- 01:23
numbers here so there's no way to calculate for the median which by the
- 01:27
way is something most older Florida drivers have no problem driving over [old driver driving slow in Florida]
- 01:32
grandparents there.. Okay, what about E are there more outliers in the Florida data well
- 01:38
there might be but that's not something we know simply by being told the width [Box width of Florida students]
- 01:42
of its box is bigger maybe it's just moving and needs to transport it's rock [Old man transporting a rock]
- 01:46
collection well snap the answer here is C; there's more variation in the
- 01:51
amount of time spent outdoors for those in Florida than for those in Maine. That's
- 01:56
what the width of the box tells us that there's a larger spread in the data so
- 02:00
C it is. If you want to know a real party state though, check out Iowa it's [Man on a DJ set at a club]
- 02:05
amazing what a good time you can have in cornfield with just the right lighting [People partying with colorful lights in a cornfield]
- 02:09
and music
Up Next
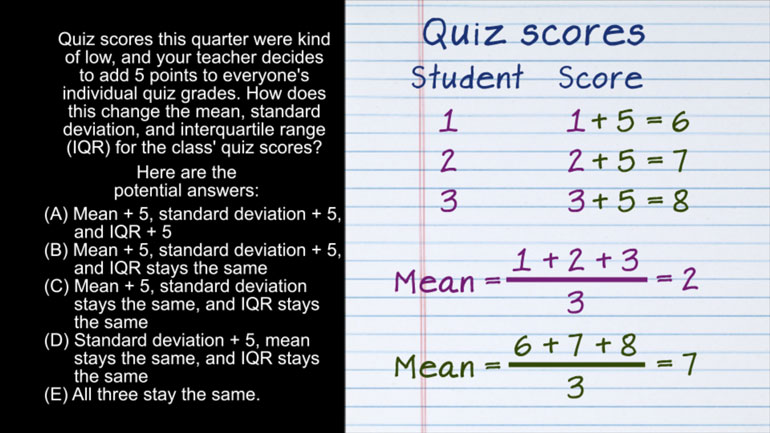
AP Statistics 2.1 Exploring Data. How does this change affect the mean, standard deviation, and IQR?
Related Videos
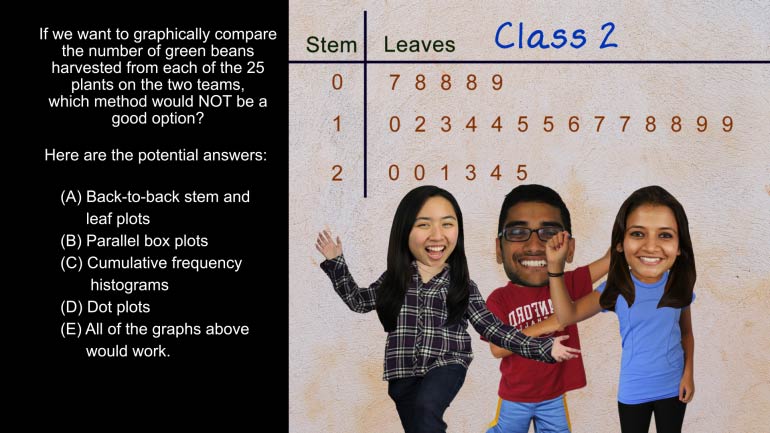
AP Statistics 5.2 Exploring Data. Which method would not be a good option?

AP Statistics 1.5 Statistical Inference. Which of the following statements is false?

Want to pull an Oliver Twist and ask us for more? We've gotcha covered. Head over to /video/subjects/math/test-prep/ap-statistics/ for more AP...
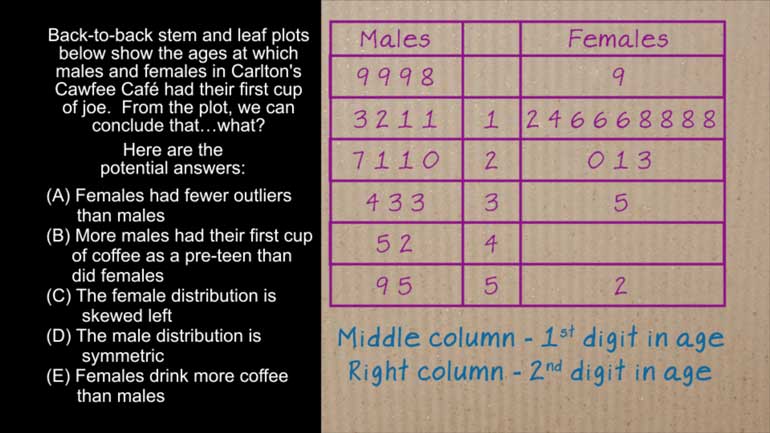
AP Statistics 4.5 Exploring Data. What can we conclude from the plot?