ShmoopTube
Where Monty Python meets your 10th grade teacher.
Search Thousands of Shmoop Videos
AP Statistics 2.1 Statistical Inference 49 Views
Share It!
Description:
Want to pull an Oliver Twist and ask us for more? We've gotcha covered. Head over to /video/subjects/math/test-prep/ap-statistics/ for more AP Statistics goodness. No porridge included.
Transcript
- 00:04
And here's your shmoop du jour brought to you by eye
- 00:06
drops keeping finish line photographers in business since 1945..Your principal [man photographs the end of a horse race]
- 00:12
wants to know the difference in lateness between students who ride their bikes to
- 00:16
school and those who drive there, if a confidence interval contains two
- 00:20
positive numbers what does this information mean for your principal and
Full Transcript
- 00:24
here the potential answers.. Okay in other words who
- 00:32
causes that five minutes after the bell stampede every morning? Is it the sweaty [Students scramble into the school as alarm bell rings]
- 00:37
two wheelers, or the amateur NASCAR drivers in the parking lot well to get the answer [Motorbike and car arrive at school and students appear]
- 00:41
the principal has hired a statistician who proceeded to calculate a 95%
- 00:45
confidence interval that percentage is for the difference between
- 00:49
the proportion of bike riders who were late and the proportion of car drivers [person riding a bike and a car ride past the principal]
- 00:54
who were late...So besides being curious about what they're serving in the
- 00:59
cafeteria for lunch what else does the guy with the clipboard need to know [Man holding a clipboard in the school corridor]
- 01:02
nothing.. exactly, he has what he needs there's no missing link here people stay
- 01:08
with us for a second since the confidence interval was given we don't [Student discussing sample size at the front of the class]
- 01:11
need sample sizes an actual proportion so we can eliminate C and D as possible
- 01:16
answers we're comparing bike riders to car drivers and those positive numbers in
- 01:20
the confidence interval indicates that bike riders are late more than car [Bike and car appear]
- 01:24
drivers which means that A is the correct answer the only other conclusion
- 01:29
to be made from this exercise is that there are more bike riders than car [Students holding bike helmets outside the principal's office]
- 01:32
drivers waiting outside the principal's office..no one ever said confidence
- 01:36
intervals were fair.
Up Next
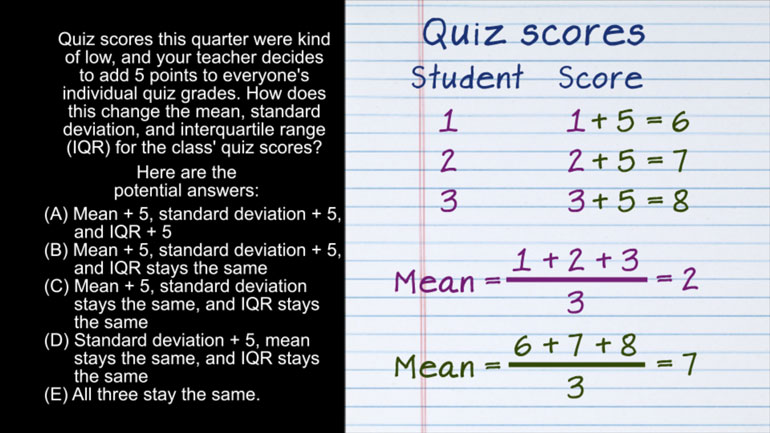
AP Statistics 2.1 Exploring Data. How does this change affect the mean, standard deviation, and IQR?
Related Videos
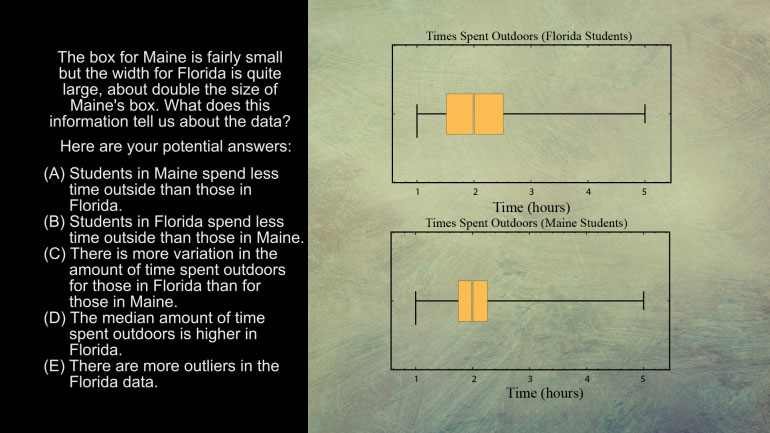
AP Statistics 5.1 Exploring Data. What does this information tell us about the data?
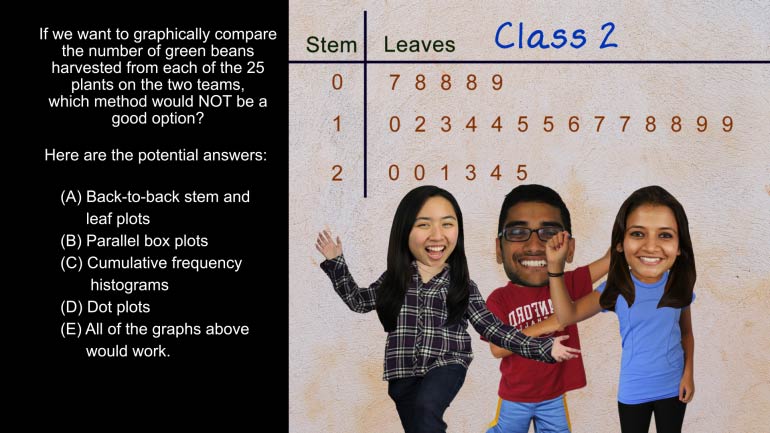
AP Statistics 5.2 Exploring Data. Which method would not be a good option?
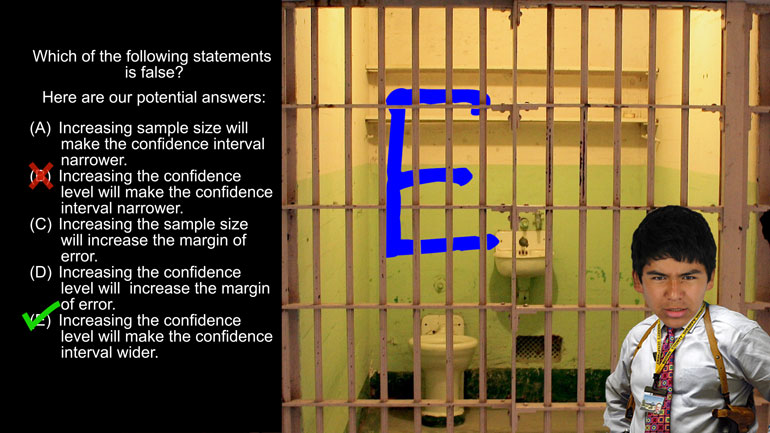
AP Statistics 1.5 Statistical Inference. Which of the following statements is false?
AP Statistics 4.5 Exploring Data. What can we conclude from the plot?