ShmoopTube
Where Monty Python meets your 10th grade teacher.
Search Thousands of Shmoop Videos
Data Analysis, Statistics, and Probability Videos 36 videos

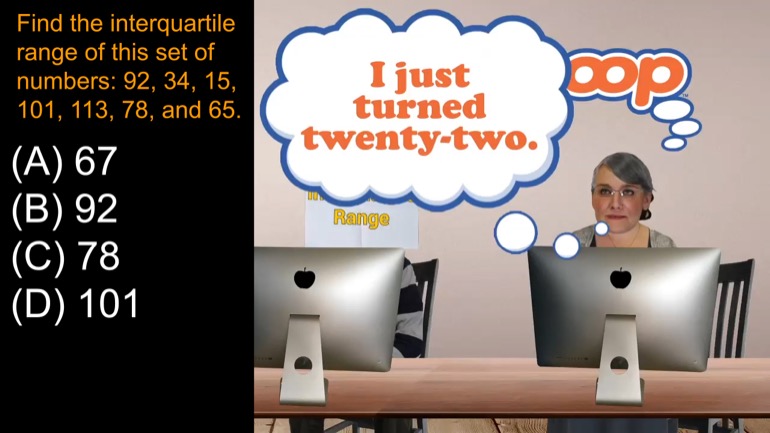
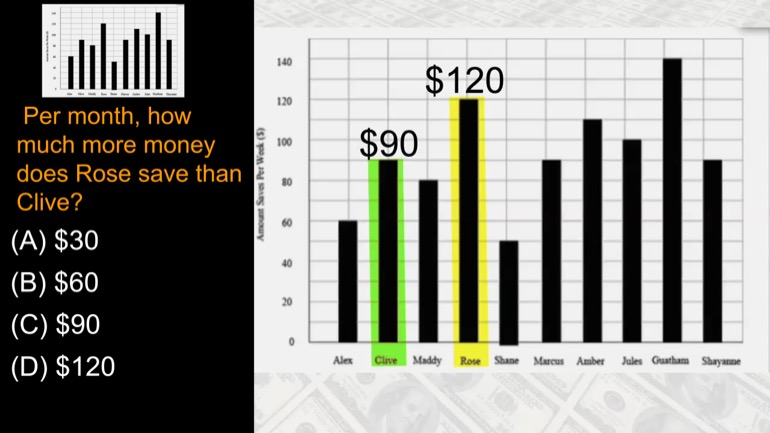
Per month, how much more money does Rose save than Olive?
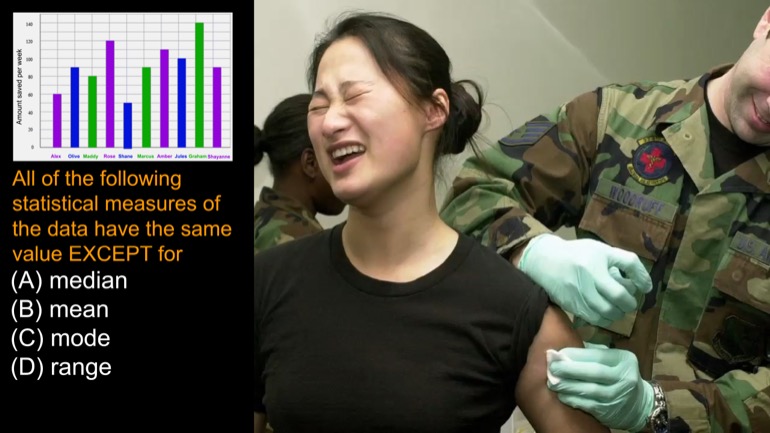
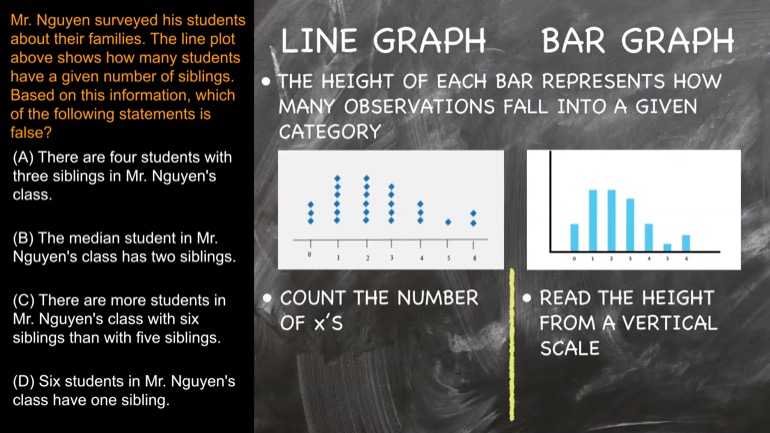
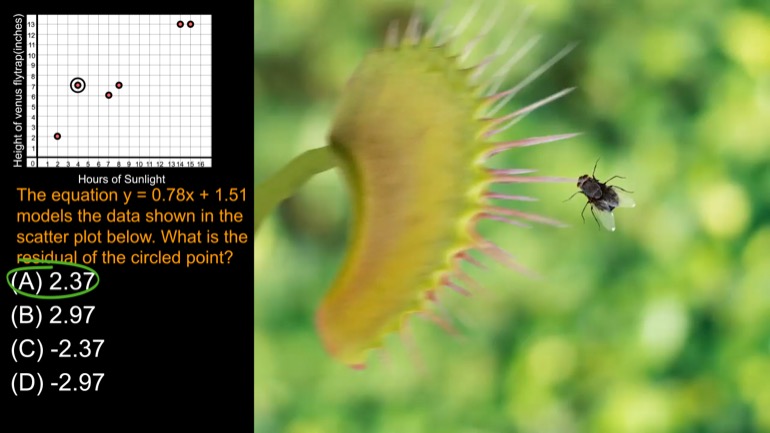
All of the following statistical measures of the data above have the same value EXCEPT for
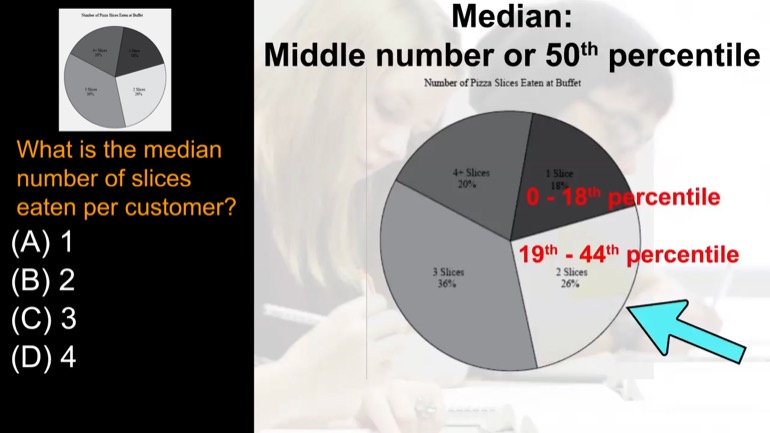
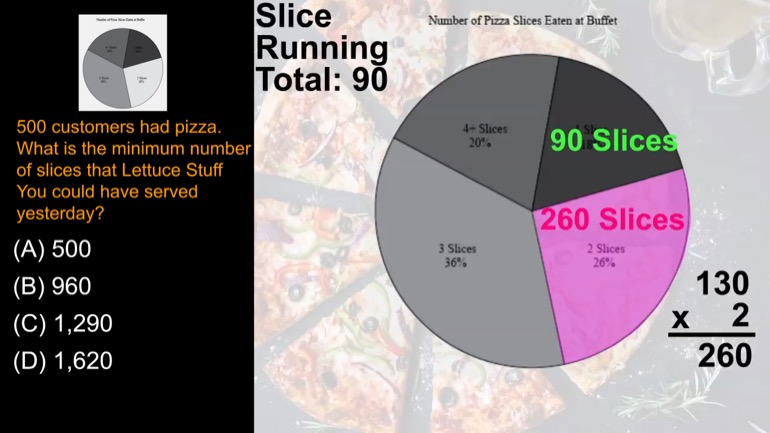
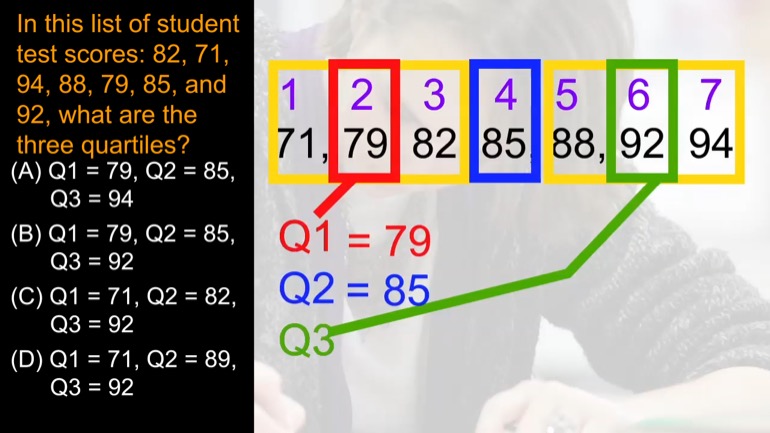
What is the median number of slices eaten per customer?
TSI Math: Determining Probabilities from Information In a Table 21 Views
Share It!
Description:
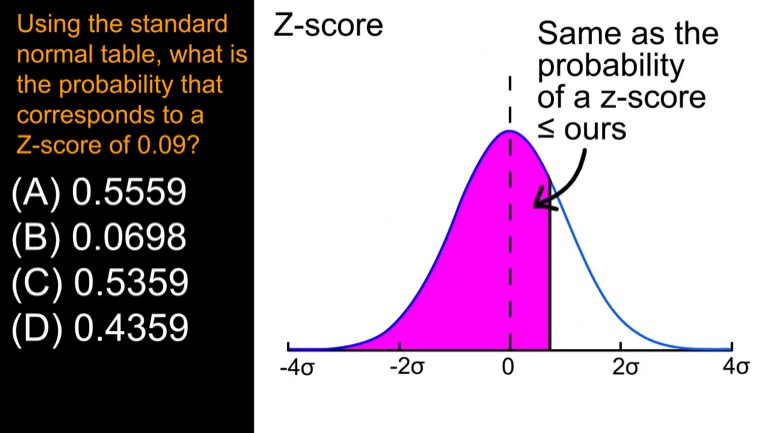
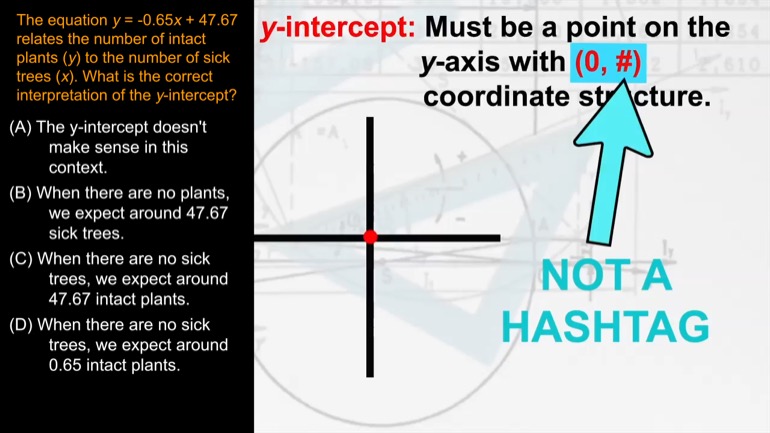
Using this standard normal table, what is the probability that corresponds to a Z-score of 0.09?
- Data Analysis, Statistics, and Probability / Statistical Measures
- TSI Math / Data Analysis, Statistics, and Probability
- Test Prep / TSI
- TSI Mathematics / Data Analysis, Statistics, and Probability
- TSI / TSI Math
- Data Analysis, Statistics, and Probability / Statistical Measures
- TSI / TSI Mathematics
- Test Prep / TSI
Transcript
- 00:03
Okay sy match members ron to statistical measures and we're
- 00:08
going to live inside this normal table for a lot
- 00:11
of it So look at this thing right here Normal
- 00:13
table What is the probability that corresponds to a z
- 00:17
score of point O nine Well we've got a z
Full Transcript
- 00:24
scored we need the probability we're trying to find the
- 00:26
probability of getting that z score or score less than
- 00:29
that z score Let's according to question here to remember
- 00:31
that a z score is just how far we are
- 00:34
away from the mean this thing in units of standard
- 00:38
deviation like the sigma things down here a standard normal
- 00:41
curve has been studied so closely that we can plop
- 00:44
ourselves down at an easy score on the x axis
- 00:47
and immediately determine the area under the curve to the
- 00:49
left of that value which is the same as the
- 00:52
probability of a z score less than or equal to
- 00:56
ours for any z score we can imagine so let's
- 00:59
think about this We'll need a standard normal table right
- 01:02
here Luckily this table will tell us the probability of
- 01:05
getting the z score we want because it's a left
- 01:08
area ze table So you have to check that if
- 01:10
this were a table that shows the area to the
- 01:12
right of a z score we have to subtract the
- 01:14
value we get from the table from one right one
- 01:18
is one hundred percent or entire area there under the
- 01:20
curve So r z scores point o nine We'll need
- 01:23
to zip line down to the second page where we
- 01:26
see the zero point zero row there right at the
- 01:29
top Then we crab crawl across to the column headed
- 01:33
by point Oh nine i think in a cell at
- 01:35
the intersection of that roman column is our probability which
- 01:39
is what is this point Five three five eight six
- 01:43
Alright we'll round that off a bit and it gives
- 01:45
us a probability of five three five nine Well we
- 01:48
must have looked in a completely different part of the
- 01:50
table to get all the other answers as none of
- 01:53
them are at the intersection of zero point to a
- 01:55
row Okay so the answer is C five three five 00:01:57.842 --> [endTime] nine that's it were statistically shmoop
Related Videos
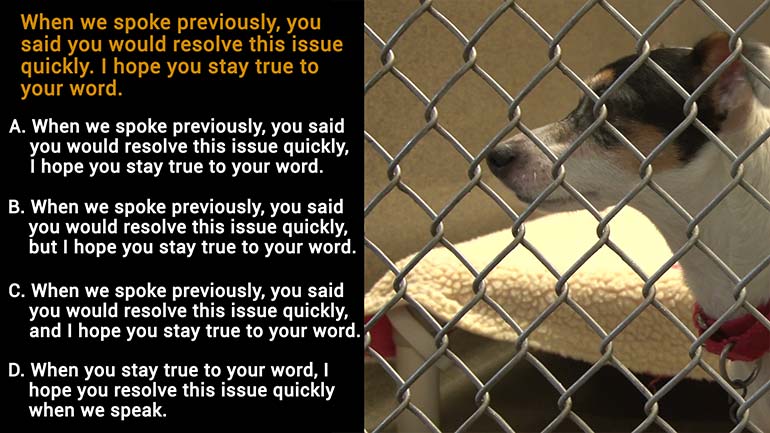
Which is the best way to revise and combine sentences 1 and 2?
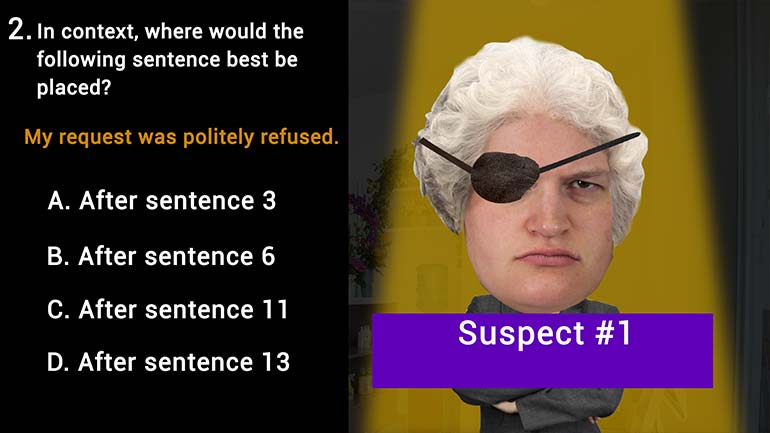
Where would the following sentence best be placed?
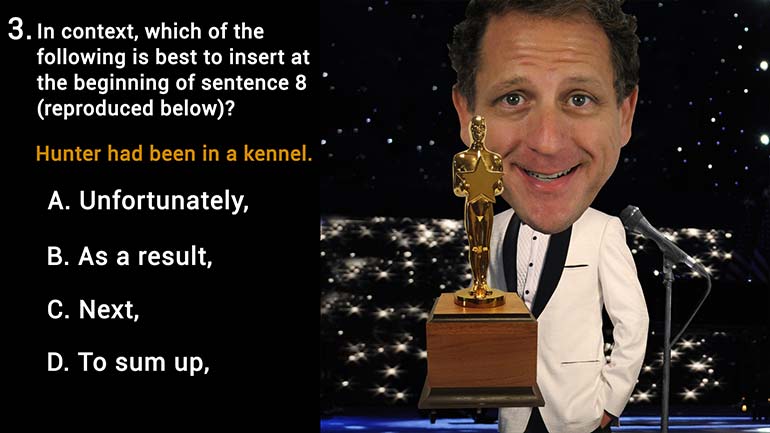
Which of the following is best to insert at the beginning of sentence 8?
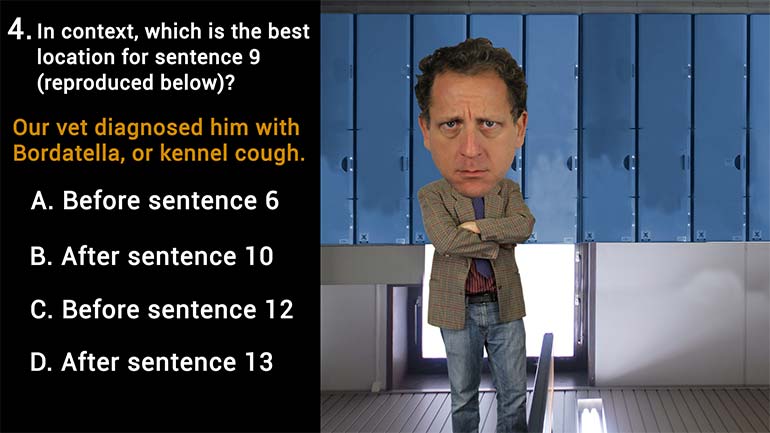
Which is the best location for sentence 9?
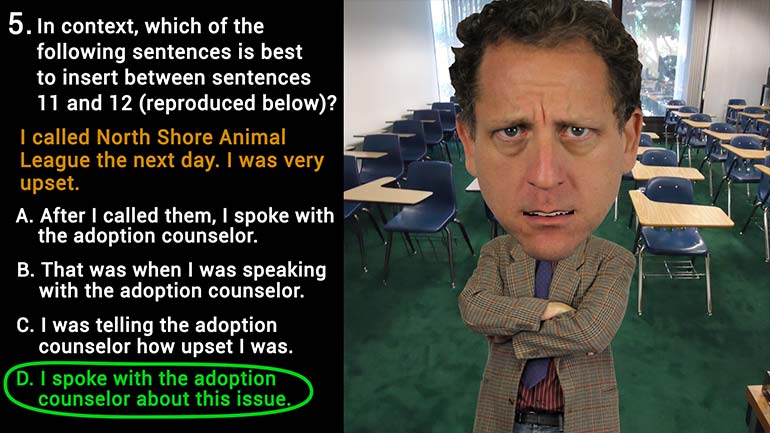
Which of the following sentences is best to insert between sentences 11 and 12?