ShmoopTube
Where Monty Python meets your 10th grade teacher.
Search Thousands of Shmoop Videos
Data Analysis, Statistics, and Probability Videos 36 videos


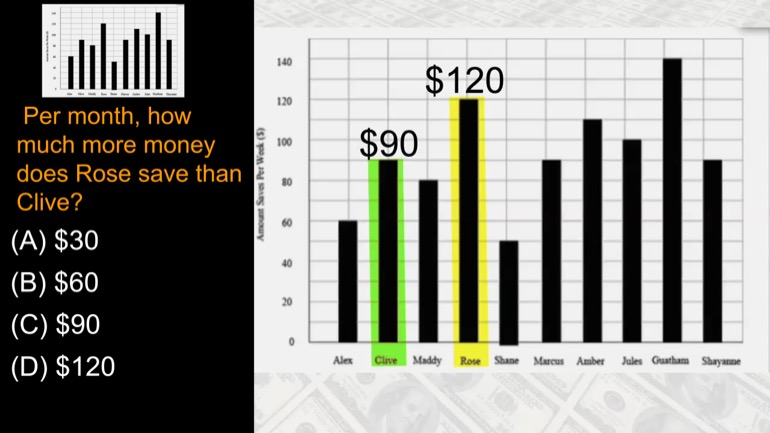
Per month, how much more money does Rose save than Olive?
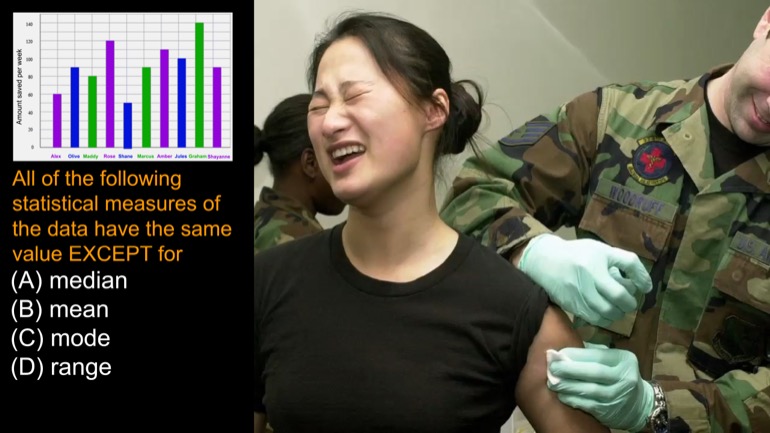
All of the following statistical measures of the data above have the same value EXCEPT for
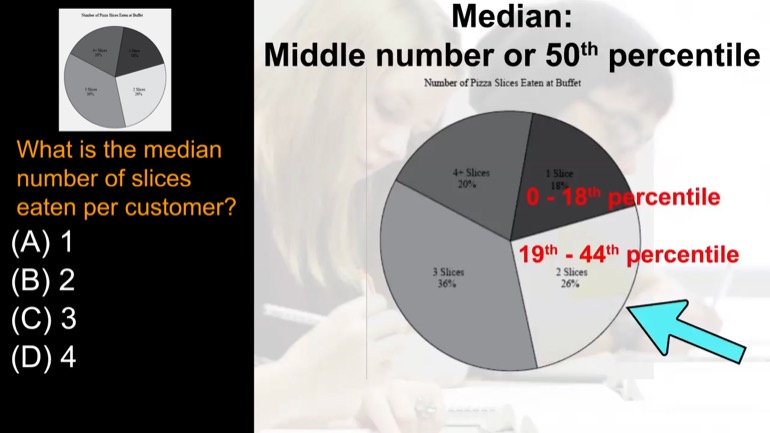
What is the median number of slices eaten per customer?
TSI Math: Reading a Circle Graph to Identify Pizza Percentages 68 Views
Share It!
Description:
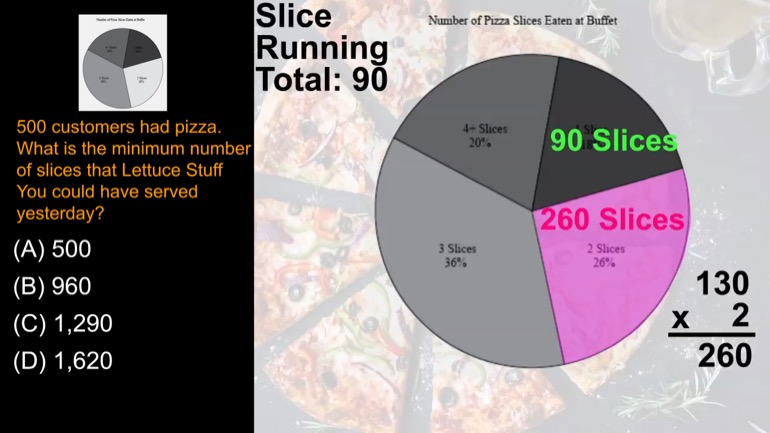
500 customers had pizza. What is the minimum number of slices that Lettuce Stuff You could have served yesterday?
- Data Analysis, Statistics, and Probability / Interpreting Categorical and Quantitative Data
- Data Analysis, Statistics, and Probability / Interpreting Categorical and Quantitative Data
- TSI Math / Data Analysis, Statistics, and Probability
- Test Prep / TSI
- TSI Mathematics / Data Analysis, Statistics, and Probability
- TSI / TSI Math
- TSI / TSI Mathematics
- Test Prep / TSI
Transcript
- 00:01
Okay sy math people we got another multi problem graph
- 00:06
thing here let us stuff you is an all you
- 00:08
can eat salad buffet recently added up Pizza section circle
- 00:12
graph here shows how many pizza slices each customer took
- 00:15
yesterday Use this info to answer questions Three and four
Full Transcript
- 00:18
Alright here's the graph and we got wow we had
- 00:21
some big eaters here Four slices Ok well five hundred
- 00:24
customers had pizza what's the minimum number of slices that
- 00:27
let us stuff You could have served yesterday Who wants
- 00:35
Let us when you could have pizza instead write the
- 00:37
customers have spoken and alright we'll break down the number
- 00:41
of pizza slices eaten by each sector of the graph
- 00:43
Eighteen percent of five hundred ninety right point one eight
- 00:47
times and then ninety customs had one slice so are
- 00:49
running total a pizza slices starts here at ninety then
- 00:52
twenty six percent of five hundred had two slices so
- 00:56
there was twenty six and five hundred and one hundred
- 00:58
thirty multiplied by two Well that's two hundred sixty slices
- 01:02
were running total here ninety plus two sixty and then
- 01:04
the next thirty six hundred customers had three slices of
- 01:07
five hundred slices there it's hundred eighty people so three
- 01:10
times that one eighties five forty running total here's eight
- 01:12
ninety and we're calculating the minimum number of slices So
- 01:15
we'll assume that each customer in the forearm or category
- 01:18
just had four slices Although somebody must have five or
- 01:21
six In that case point two times five hundred twenty
- 01:24
seven five hundred hundred customers have four slices eat so
- 01:26
add another four hundred to the pot Let us stuff
- 01:29
you served a minimum of twelve hundred ninety Pizza slices
- 01:32
yesterday one of how many pizzas that added up too
- 01:35
but that's a different problem So that's it The answer 00:01:37.406 --> [endTime] is c We are smoked in full
Related Videos
Per month, how much more money does Rose save than Olive?

The following table shows the coffee preferences of everyone in Isabelle's office. What percentage of Isabelle's coworkers put cream in their coffee?

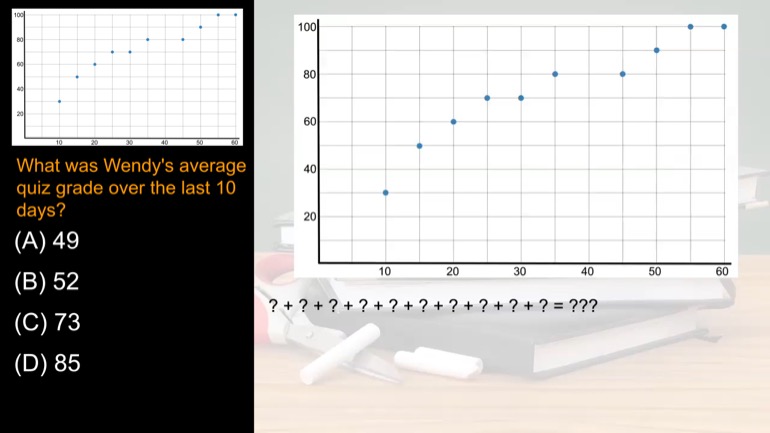
Each minute of studying increased Wendy's quiz grade by approximately how many points?
All of the following statistical measures of the data above have the same value EXCEPT for
What is the median number of slices eaten per customer?