ShmoopTube
Where Monty Python meets your 10th grade teacher.
Search Thousands of Shmoop Videos
Data Analysis, Statistics, and Probability Videos 36 videos


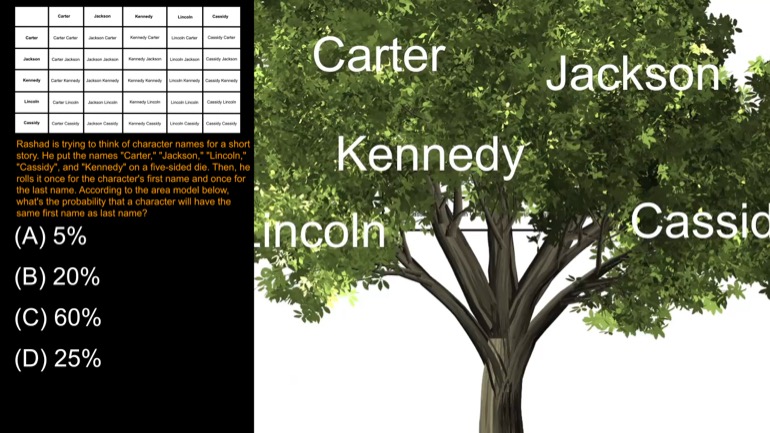
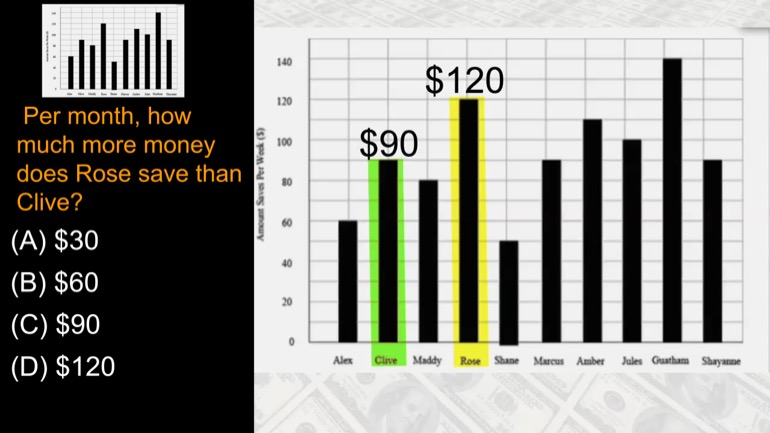
Per month, how much more money does Rose save than Olive?
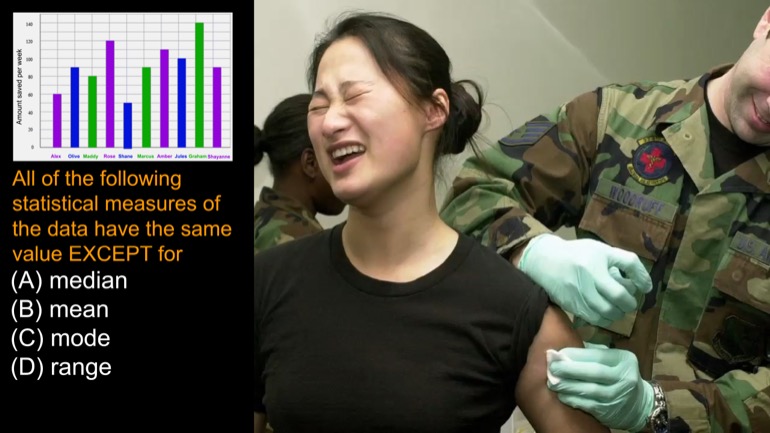
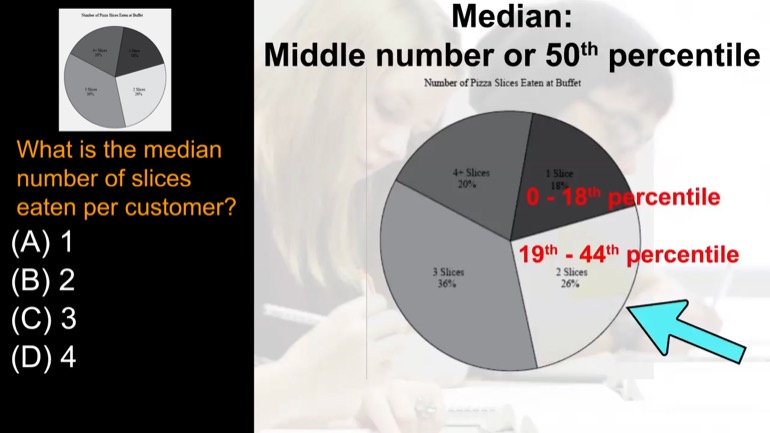
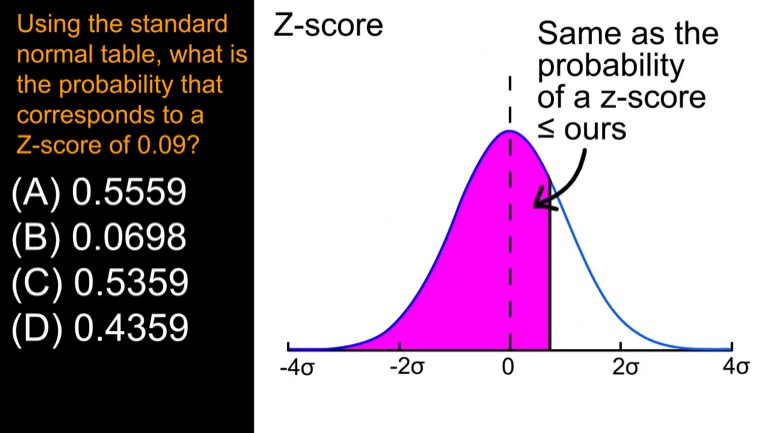
All of the following statistical measures of the data above have the same value EXCEPT for
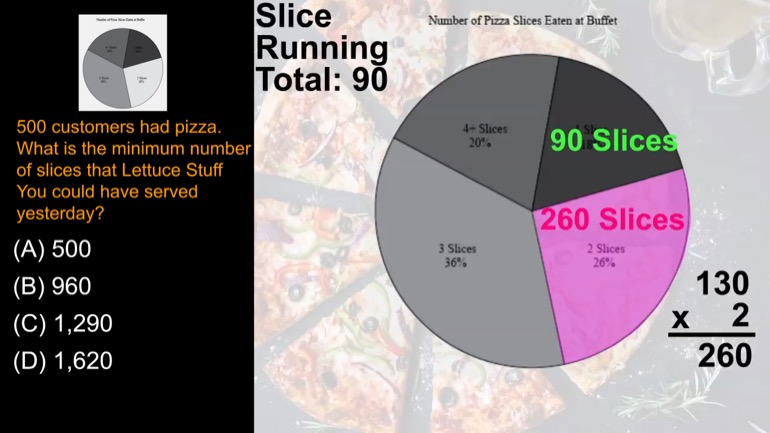
500 customers had pizza. What is the minimum number of slices that Lettuce Stuff You could have served yesterday?
TSI Math: Identifying Residuals on a Scatter Plot Graph 38 Views
Share It!
Description:
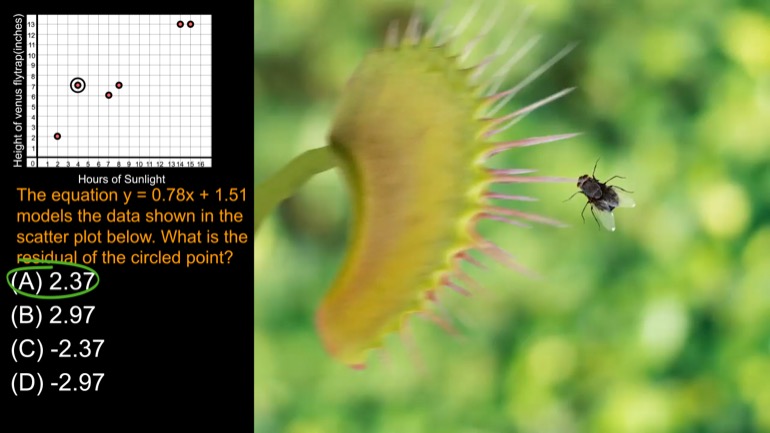
The equation y = 0.78x + 1.51 models the data shown in the scatter plot below. What is the residual of the circled point?
- Data Analysis, Statistics, and Probability / Statistical Measures
- TSI Math / Data Analysis, Statistics, and Probability
- Test Prep / TSI
- TSI Mathematics / Data Analysis, Statistics, and Probability
- TSI / TSI Math
- Data Analysis, Statistics, and Probability / Statistical Measures
- TSI / TSI Mathematics
- Test Prep / TSI
Transcript
- 00:02
Okay sy mass from uppers The equation Why equals point
- 00:05
seven eight x plus one point five one models that
- 00:08
data shown in a scatter plot below what's the residual
- 00:12
of the circled point Well the residual is the vertical
- 00:21
distance between an actual data point and the y value
Full Transcript
- 00:23
predicted by the linear regression equation at the same x
- 00:26
value More simply said it's how far a point on
- 00:29
the scatter plot is directly above or below the linear
- 00:32
regression line Well the point we care about has a
- 00:35
coordinate of four seven If we're going to find the
- 00:38
residual we need to know what the linear regression equation
- 00:42
predicts for that same x value of four Well the
- 00:45
regression equation they give you is y coll's point seven
- 00:48
eight Acts plus 1 . 5 1 well jamming for in for acts
- 00:53
gives us why equals point seven eight times four plus
- 00:56
one point five one or four point six three well
- 00:58
all that's left is the subtracting we just need to
- 01:01
make sure we put the y value of the actual
- 01:03
data point before the subtraction sign and the linear regression
- 01:06
value after the subtraction sign what does that get us
- 01:09
what we got seven then minus four point six three
- 01:12
is two point three seven the residual of this point
- 01:14
is to point three seven meaning the actual data point
- 01:16
shows two point three seven inches Maurine The venus flytrap
- 01:20
height then is predicted by the linear regression equation for
- 01:23
four hours of sunlight So that's it answers A two
- 01:26
point three seven and may All your fly traps shmoop 00:01:29.925 --> [endTime] free
Related Videos
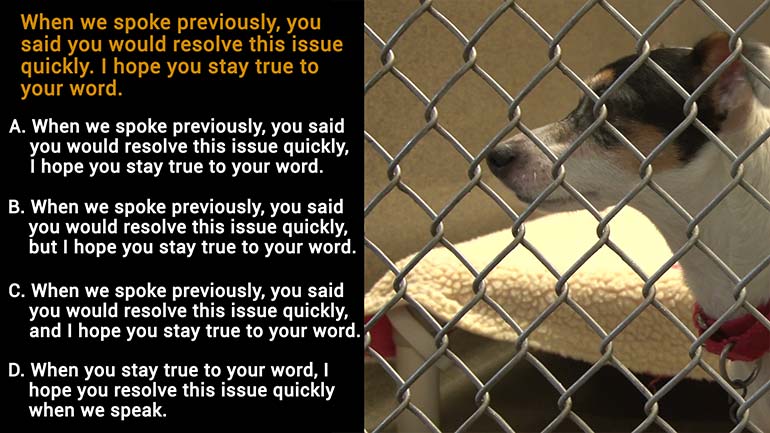
Which is the best way to revise and combine sentences 1 and 2?
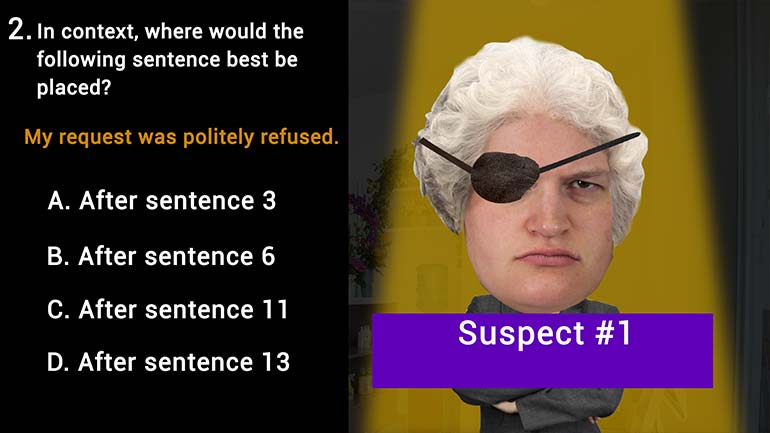
Where would the following sentence best be placed?
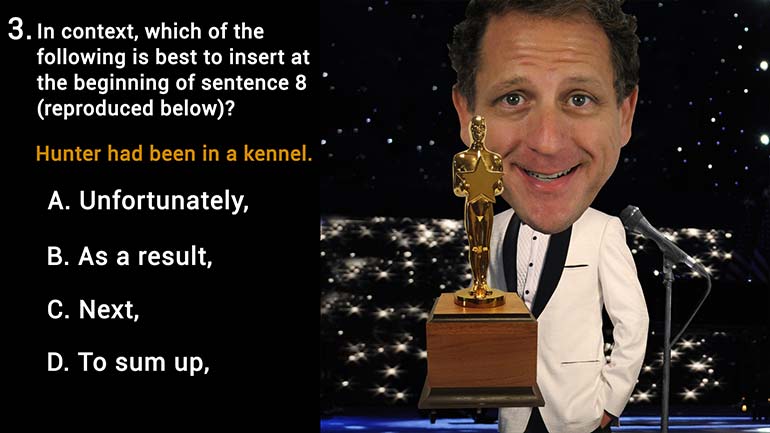
Which of the following is best to insert at the beginning of sentence 8?
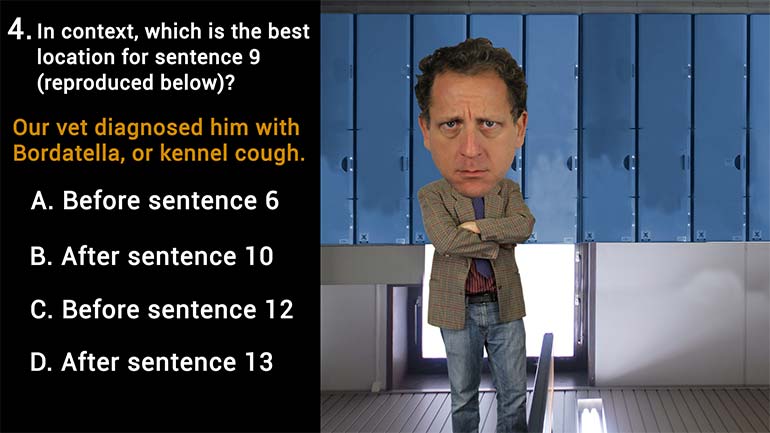
Which is the best location for sentence 9?
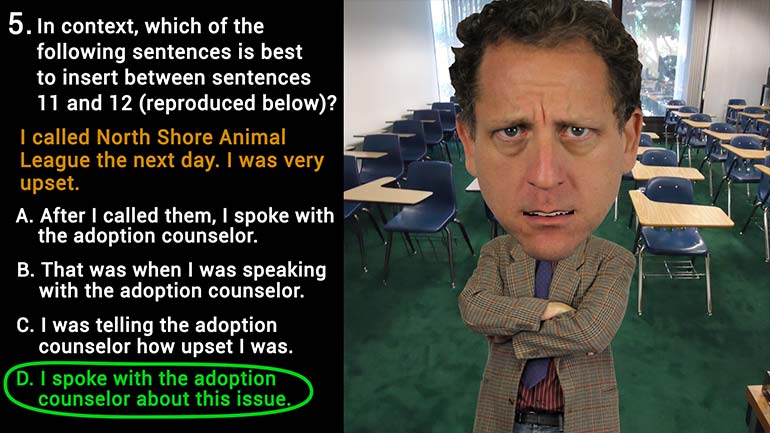
Which of the following sentences is best to insert between sentences 11 and 12?