ShmoopTube
Where Monty Python meets your 10th grade teacher.
Search Thousands of Shmoop Videos
Statistics, Data, and Probability II Videos 30 videos


CAHSEE Math Statistics, Data, and Probability II: Drill 1 Problem 1. Which of the following tables best represents the relationship between the val...

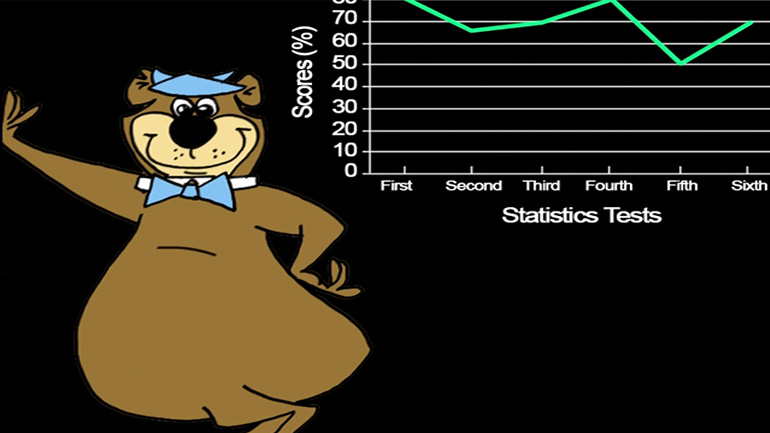
Statistics, Data, and Probability II Drill 1, Problem 2. Based on the chart, which of the following statements is true?

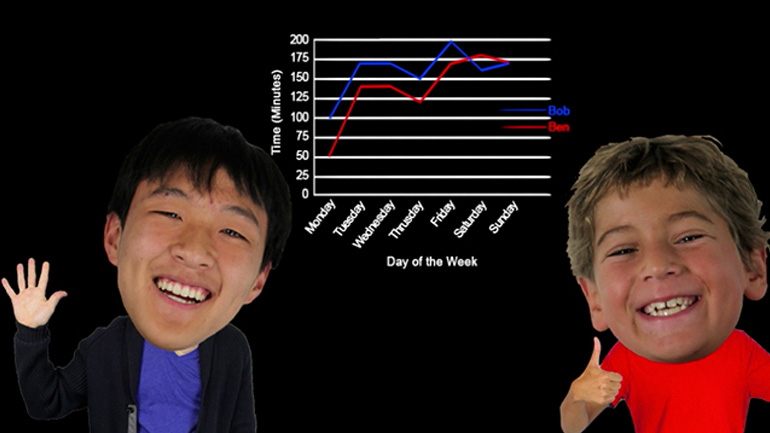
CAHSEE Math Statistics, Data, and Probability II: Drill Set 1, Problem 3. Based on the following, which of the following statements is true?
CAHSEE Math 4.5 Statistics, Data, and Probability II 176 Views
Share It!
Description:
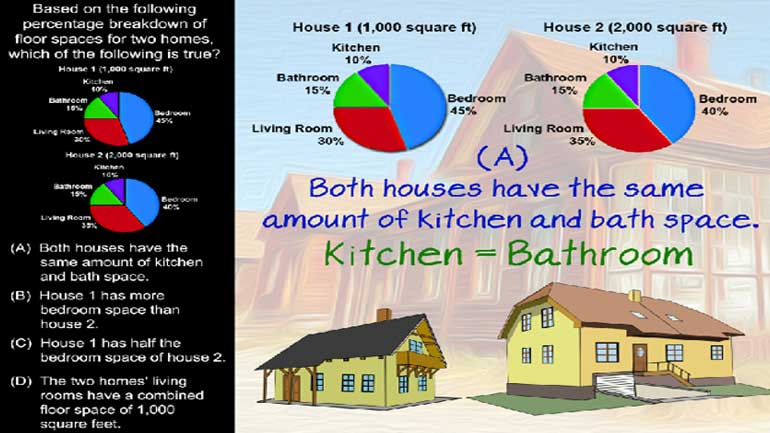
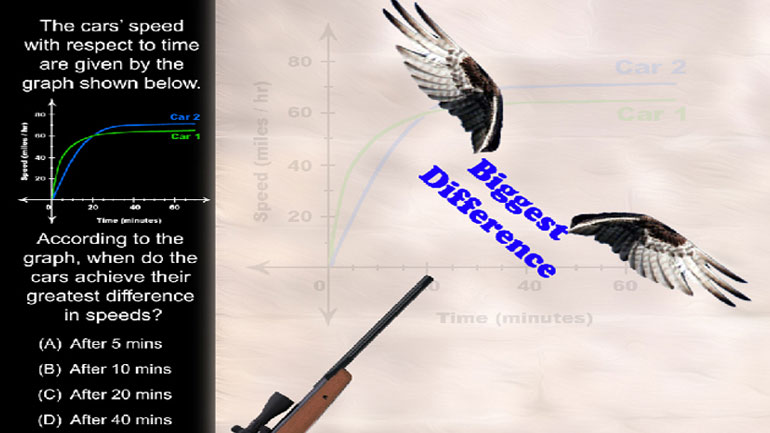
Statistics, Data, and Probability II Drill 4 Problem 5. Based on the graph, which of the following statements is true?
Transcript
- 00:03
Shmoopy question at 10 o’clock…
- 00:05
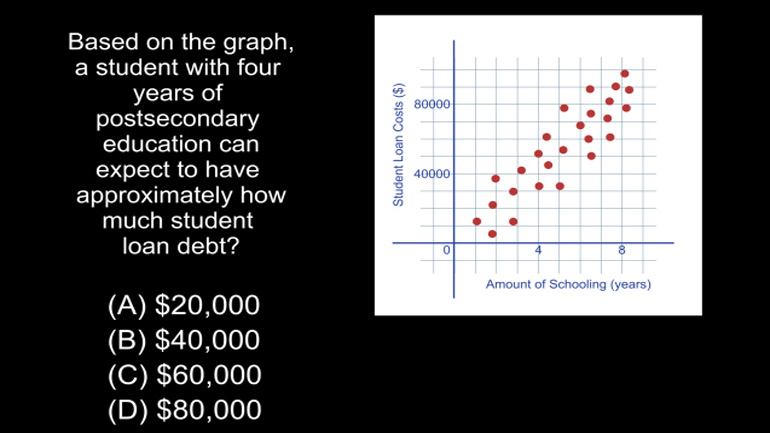
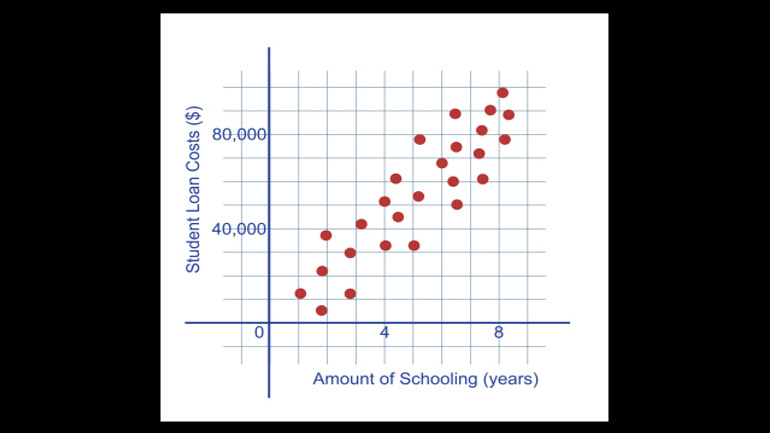
The following plot shows the relationship between the amount of postsecondary education
- 00:09
and the amount of student loan debt for several students.
- 00:12
Kinda makes you want to take over the family restaurant instead, doesn’t it?
- 00:16
Based on the graph, which of the following statements is true?
Full Transcript
- 00:19
And here are the potential answers...
- 00:27
Can we read a scatter plot? It may SOUND gross… but these puppies are really useful.
- 00:32
There’s no magic bullet to help us answer this one – we just have to go through the
- 00:35
potential answers one by one. And Boom. We don’t have to go far.
- 00:39
Option A says that there is a positive correlation between amount of education and debt –
- 00:46
and yeah – they both go up as they increase.
- 00:49
They are said to be POSITIVELY correlated.
- 00:52
All the other choices go the wrong way – that is, when the x axis increases, the y decreases
- 00:57
and vice versa.
- 00:58
So… let’s not waste time needlessly. That’s a job for the House of Representatives.
- 01:03
A is our answer.
Related Videos

CAHSEE Math: Algebra and Functions Drill 5, Problem 3. Solve the equation.

Statistics, Data, and Probability I: Drill Set 1, Problem 1. What is the mean yearly salary?

Statistics, Data, and Probability I: Drill Set 1, Problem 2. What is the median length of these writing utensils?
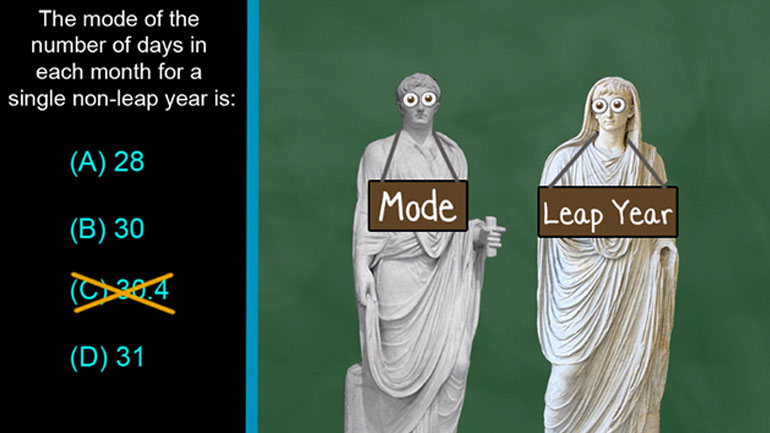
CAHSEE Math Statistics, Data, and Probability I: Drill Set 1, Problem 3. The mode of the number of days in each month for a single non-leap year is...
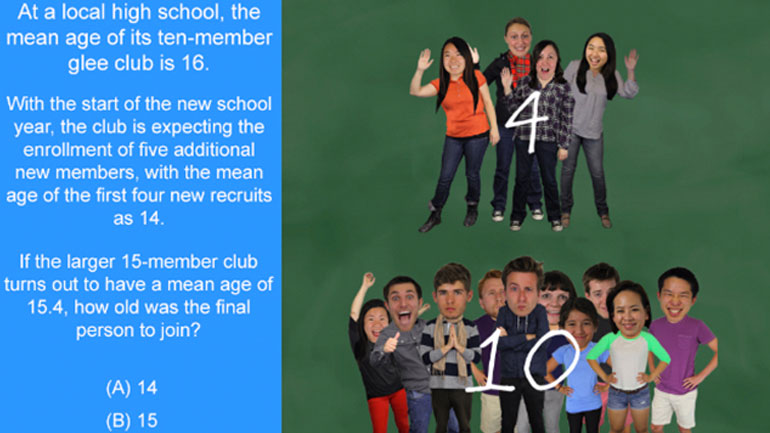
Statistics, Data, and Probability I: Drill Set 1, Problem 4. How old was the final person to join?