ShmoopTube
Where Monty Python meets your 10th grade teacher.
Search Thousands of Shmoop Videos
Statistics, Data, and Probability II Videos 30 videos


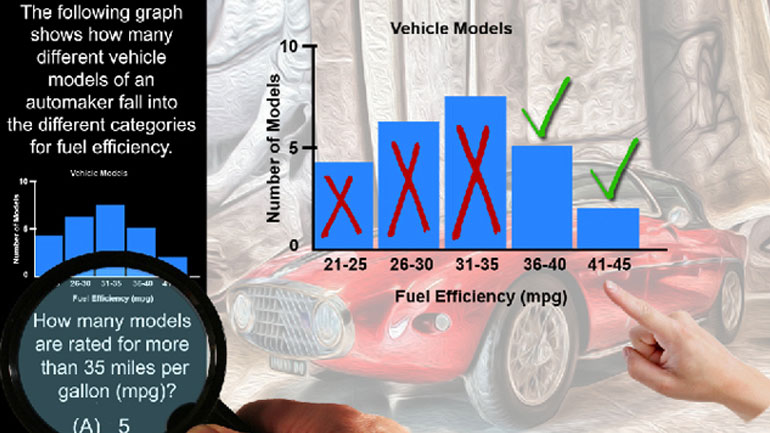


CAHSEE Math Statistics, Data, and Probability II: Drill 1 Problem 1. Which of the following tables best represents the relationship between the val...

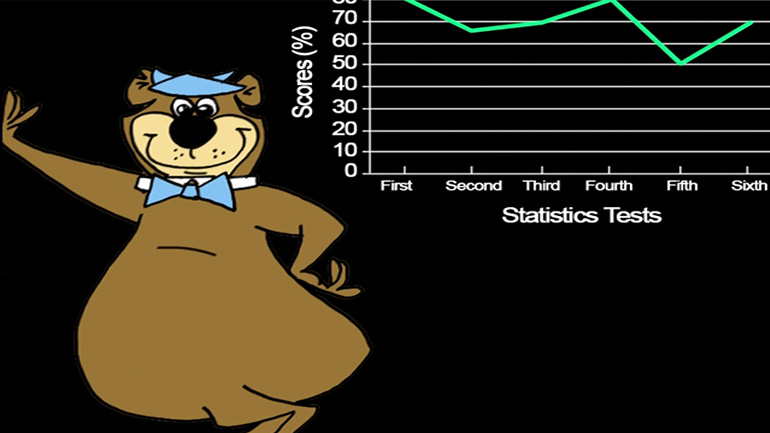
Statistics, Data, and Probability II Drill 1, Problem 2. Based on the chart, which of the following statements is true?

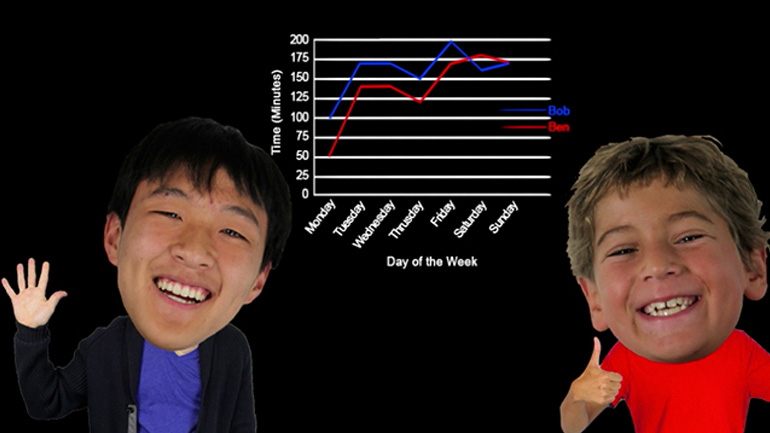
CAHSEE Math Statistics, Data, and Probability II: Drill Set 1, Problem 3. Based on the following, which of the following statements is true?
CAHSEE Math 4.2 Statistics, Data, and Probability II 195 Views
Share It!
Description:
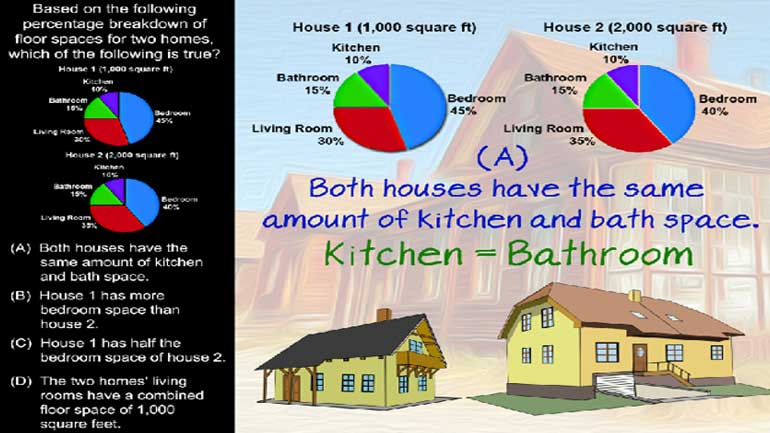
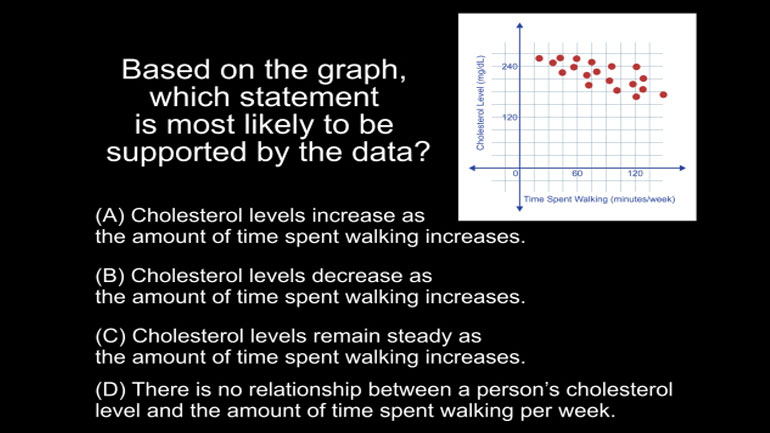
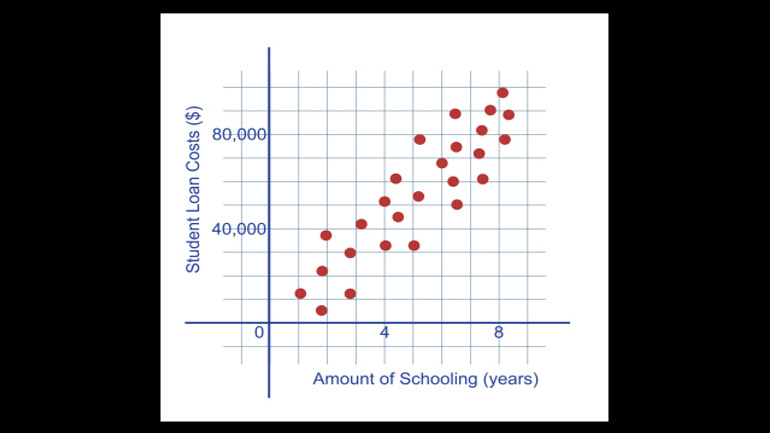
Statistics, Data, and Probability II Drill 4 Problem 2. Based on the graph, which statement is most likely to be supported by the data?
- Statistics and Probability / Summarize, represent, and interpret data on two variables
- Statistics and Probability / Summarize, represent, and interpret data on two variables
- Statistics and Probability / Understand and evaluate random processes underlying statistical experiments
- Statistics and Probability / Make inferences and justify conclusions from sample surveys, experiments, and observational studies
- Statistics and Probability / Summarize, represent, and interpret data on two variables
- Statistics and Probability / Summarize, represent, and interpret data on two variables
- Statistics and Probability / Summarize, represent, and interpret data on two variables
- Statistics and Probability / Understand and evaluate random processes underlying statistical experiments
- Statistics and Probability / Make inferences and justify conclusions
- Statistics, Data Analysis, and Probability 7 / Scatterplots
Transcript
- 00:03
One shmoop or two?
- 00:05
The following graph shows points representing the relationship between the amount of time
- 00:09
spent walking per week and cholesterol levels of various people.
- 00:13
It’s also a pretty good diagram of what the red blood cells look
- 00:16
like in those higher-cholesterol people…
Full Transcript
- 00:18
Based on the graph, which statement is most likely to be supported by the data?
- 00:23
And here are the potential answers...
- 00:32
Can we read a scatter plot? Well, that’s what it's asking anyway.
- 00:37
Let’s go through the potential answers one by one.
- 00:41
So A says “Cholesterol levels increase as the amount of time spent walking increases.”
- 00:47
Well...if A were to be true, the dots would follow this kind of line like from the
- 00:51
origin up and to the right about a 45 degree angle –
- 00:55
yet here, we don’t see that at all… so A is false.
- 00:59
B. “Cholesterol levels decrease as the amount of time spent walking increases.”
- 01:03
Well B is sorta true – yes, they do decrease but not dramatically.
- 01:07
We’re looking for the BEST answer here so let’s keep reading.
- 01:11
C. “Cholesterol levels remain steady as the amount of time spent walking increases.”
- 01:17
Hm – no – they definitely decline – just not all that much. So C is definitely false.
- 01:23
OK… D. “There is no relationship between a person's cholesterol level and the amount
- 01:27
of time spent walking per week.”
- 01:29
D might be true… but it looks like there clearly is a pattern here – just not a dramatic one.
- 01:35
If it was dramatic, the line would look like this…
- 01:37
…and, well, our nation’s sidewalks might be more crowded.
- 01:40
But ok, clearly the BEST answer is B.
- 01:43
As in, “Bypass surgery.”
Related Videos

CAHSEE Math: Algebra and Functions Drill 5, Problem 3. Solve the equation.


Statistics, Data, and Probability I: Drill Set 3, Problem 4. How many different avatars can be created based on the given options?

Statistics, Data, and Probability II Drill 3 Problem 2. Which two sports together make up for the preferences of more than half of all those w...

Statistics, Data, and Probability II Drill 3 Problem 3. One hundred twenty of those who were asked preferred what sport?