ShmoopTube
Where Monty Python meets your 10th grade teacher.
Search Thousands of Shmoop Videos
College and Career Videos 565 videos


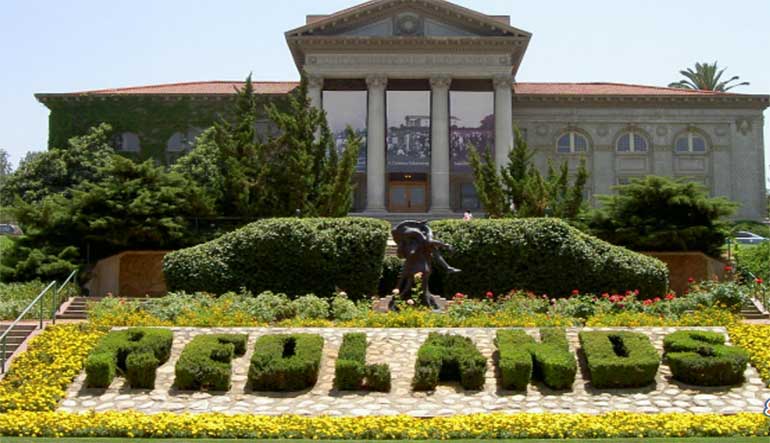
Get ready to sing some nonsense words, because today we're taking a look at the University of Redlands. You'll know what we're talking about soon e...

Grab a char-dog and watch out for flaming birds, it's time to take a tour of the University of Chicago. Oh and erm, if you would sign this waiver f...

We're talking about the tasks you'll need to complete before graduating here...not a literal life-threatening maze. Colleges aren't that cruel...
Finance: What are Ascending and Descending Tops and Triangles? 2 Views
Share It!
Description:
What are ascending and descending tops and triangles? Ascending and descending tops and triangles are used to describe market performance graphs. The tops are the peaks on the graphs; if they are ascending then the market is improving with each time period, if they are descending the market is dropping with each time period. The triangles are created by making a line through the bottom of these shapes that signals either upward or downward trends in the stock or overall market, depending on the type of top.
- Social Studies / Finance
- Finance / Financial Responsibility
- College and Career / Personal Finance
- Life Skills / Personal Finance
- Finance / Finance Definitions
- Life Skills / Finance Definitions
- Finance / Personal Finance
- Courses / Finance Concepts
- Subjects / Finance and Economics
- Terms and Concepts / Bonds
- Terms and Concepts / Charts
- Terms and Concepts / Metrics
- Terms and Concepts / Regulations
- Terms and Concepts / Stocks
- Terms and Concepts / Trading
- Finance and Economics / Terms and Concepts
Transcript
- 00:00
Finance a la shmoop what are asending and descending tops and triangles well
- 00:08
it's almost like a stock breakout to the good is being squeezed out the end right [Ascending triangle stock prices on a graph]
- 00:13
here... well in this pattern it's like the stock can't help but go up at
- 00:17
the end of the triangles here well ascending tops and triangles is a trading
- 00:22
pattern used by Chartist style traders ie traders who just focus on the graphic
Full Transcript
- 00:27
representation of stock performance, well the same holds true for descending tops
- 00:32
and triangles basically take everything we said here and invert it..Oh head rush [Triangle inverted on graph]
- 00:38
there flip that back over - Note the pattern here of ups and downs but as
- 00:43
time progresses the blue line at the bottom acts as if it's a lower limit [Arrow points to blue lower limit line]
- 00:47
where the stock can't bounce through that virtual floor it just goes up and
- 00:51
then one day like as zit that's bursting at the seams well the stock pops and
- 00:55
creates a new set of ascending tops and triangles hopefully it doesn't leave a
- 00:59
pock mark on your portfolio well when it does that [Man holding up portfolio]
Related Videos
GED Social Studies 1.1 Civics and Government

What is bankruptcy? Deadbeats who can't pay their bills declare bankruptcy. Either they borrowed too much money, or the business fell apart. They t...

What's a dividend? At will, the board of directors can pay a dividend on common stock. Usually, that payout is some percentage less than 100 of ear...

How are risk and reward related? Take more risk, expect more reward. A lottery ticket might be worth a billion dollars, but if the odds are one in...