ShmoopTube
Where Monty Python meets your 10th grade teacher.
Search Thousands of Shmoop Videos
ACT Science 3.1 Data Representation Passage 244 Views
Share It!
Description:
ACT Science: Data Representation Passage Drill 3, Problem 1. What correlation can be drawn between the carbon-14 content the year a patient was born and the carbon-14 content in that individual's eye proteins?
Transcript
- 00:03
Here’s your shmoop du jour, brought to you by carbon-14 dating.
- 00:07
The antidote to match.com.
- 00:24
What correlation can be drawn between the carbon-14 content the year a patient was born
- 00:28
and the carbon-14 content in that individual's eye proteins?
- 00:33
And here are the potential answers...
Full Transcript
- 00:38
So we’re looking for a CORRELATION. Just another word for relationship.
- 00:42
But which figure do we use?
- 00:44
Well, figure 1 gives us the amount of carbon-14 the year a patient is born compared to
- 00:49
the amount of carbon-14 in that individual’s eye protein….exactly what we’re looking for.
- 00:55
So, to answer this question correctly, all we need to do is refer to figure 1.
- 01:00
Figure 1 shows that the amount of carbon-14 (14C) in an individual's eye is directly related
- 01:06
to the amount of 14C in the atmosphere at the time of that individual's birth.
- 01:15
Notice how the red line showing model output of 14C in the eye is almost exactly on top
- 01:20
of the grey line showing the 14C content in the atmosphere.
- 01:24
That means that both values are nearly identical.
- 01:27
Choice C just happens to use the exact words, “nearly identical”.
- 01:31
And that's our answer.
- 01:33
You can find love out there if you're carbon-14 dating enough.
Up Next
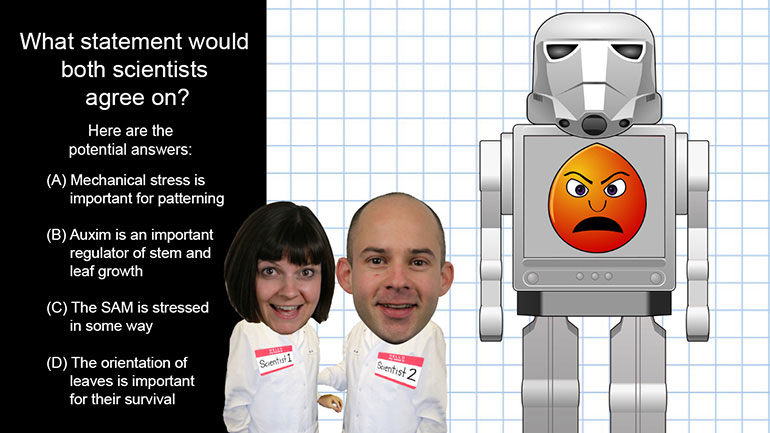
ACT Science: Conflicting Viewpoint Passage Drill 1, Problem 1. What statement would both scientists agree upon?
Related Videos
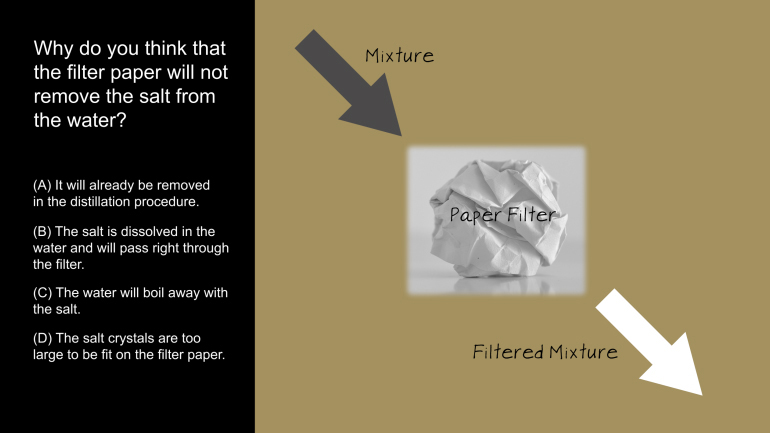
ACT Science: Research Summary Passage Drill 2, Problem 1. Why do you think that the filter paper will not remove the salt from the water?

When you're about to marry the love of your life, not many things could stop you. However, finding out that your future hubby is keeping his crazy...
Here at Shmoop, we work for kids, not just the bottom line. Founded by David Siminoff and his wife Ellen Siminoff, Shmoop was originally conceived...

ACT Math: Elementary Algebra Drill 4, Problem 5. What is the solution to the problem shown?