ShmoopTube
Where Monty Python meets your 10th grade teacher.
Search Thousands of Shmoop Videos
AP Statistics 1.1 Exploring Data 326 Views
Share It!
Description:
AP Statistics 1.1 Exploring Data. What should this histogram always be?
Transcript
- 00:00
Thank you We sneak And here's your shmoop du jour
- 00:05
brought to you by cheerios Once you have a kid
- 00:08
it's the cereal that pretty much follows you everywhere you
- 00:12
know that All right we constructed a cumulative frequency hissed
- 00:15
a gram to display the number of cheerio students counted
Full Transcript
- 00:18
in each of their morning bowls Is they had nothing
- 00:20
better to do this history Graham should always be what
- 00:24
and hear the potential answer Already so let's put down
- 00:29
our spoons for a second See if we can wrap
- 00:31
our heads around this thing We're being asked about a
- 00:34
cumulative frequency hissed a gram Well when talking about something
- 00:38
that's cumulative we're referring to something that keeps increasing or
- 00:43
a kind of snowballs although maybe that's confusing since snowballs
- 00:47
are in an entirely different food groups All right well
- 00:50
we're looking at students who have a certain number of
- 00:52
cheerios in their bowl each morning and we want to
- 00:54
hissed a gram that'll show that data but because it's
- 00:57
going to show cumulative data the bars of our history
- 01:00
um are going to get bigger as we move from
- 01:03
left to right glowing not so fast you'll get ahead
- 01:07
Russia stopped their bars get increasingly bigger because we keep
- 01:11
adding new data to the one before and any time
- 01:14
in distribution has a smaller amount of data on the
- 01:16
left Then on the right we say that it's skewed
- 01:20
left not as much as msnbc orwell journalists in general
- 01:24
but still pretty you left So looking over our answer
- 01:28
choices it appears that choice a skewed left fits the
- 01:32
bill as a side note We really resent the implication
- 01:34
that ebola cheerios is only a suitable meal option In
- 01:37
a m you can sear them with some tilapia Throw
- 01:40
in a serving of chocolate dipped brussel sprouts and you've 00:01:43.62 --> [endTime] got yourself a balanced diet
Up Next
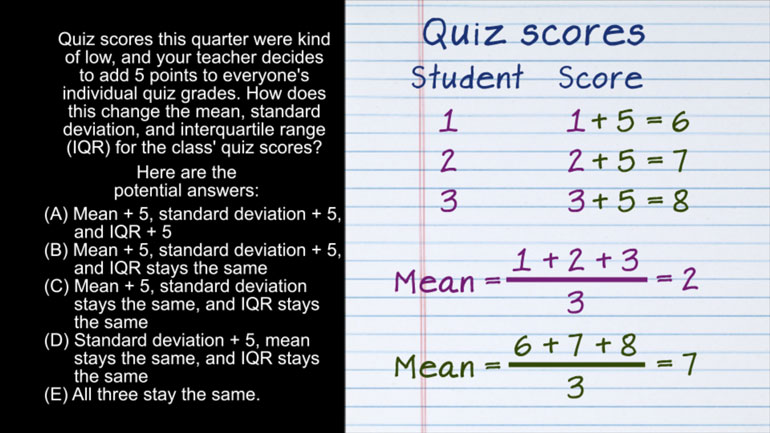
AP Statistics 2.1 Exploring Data. How does this change affect the mean, standard deviation, and IQR?
Related Videos
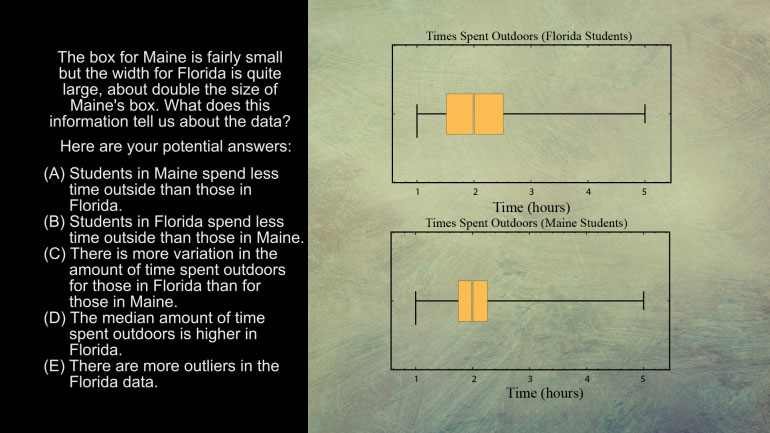
AP Statistics 5.1 Exploring Data. What does this information tell us about the data?
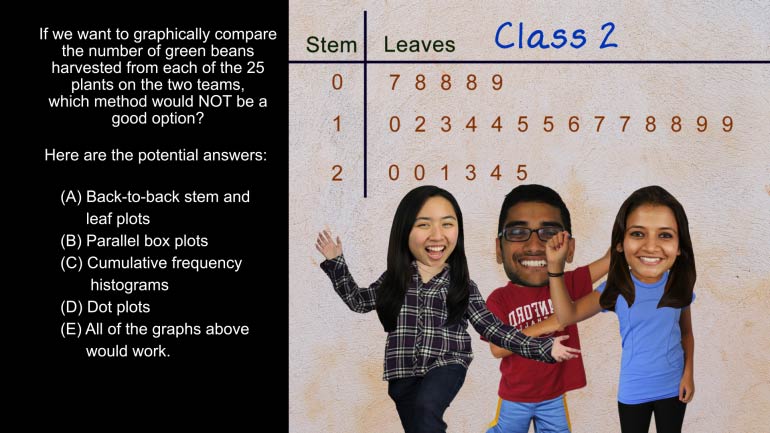
AP Statistics 5.2 Exploring Data. Which method would not be a good option?
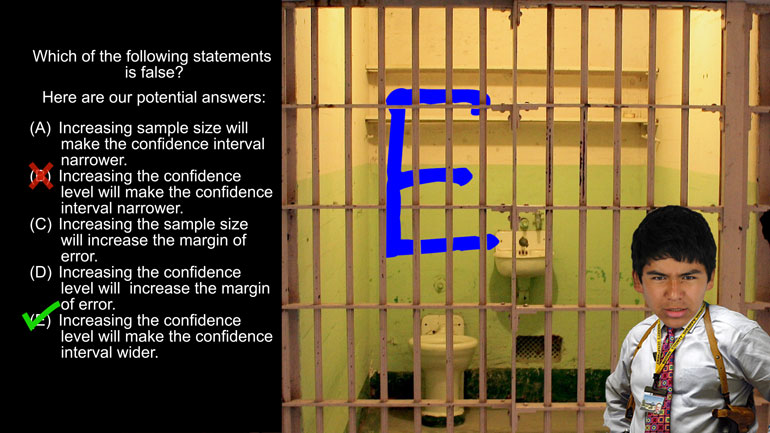
AP Statistics 1.5 Statistical Inference. Which of the following statements is false?

Want to pull an Oliver Twist and ask us for more? We've gotcha covered. Head over to /video/subjects/math/test-prep/ap-statistics/ for more AP...