ShmoopTube
Where Monty Python meets your 10th grade teacher.
Search Thousands of Shmoop Videos
AP Statistics 1.3 Exploring Data 222 Views
Share It!
Description:
AP Statistics 1.3 Exploring Data. The distribution of the data is what?
Transcript
- 00:00
Thank you We sneak and here's your spoke to sure
- 00:05
brought to you by flying squirrels Sadly most of them
- 00:08
can only afford to travel in coach All right It
- 00:11
seems that the squirrels in town are having a rough
- 00:13
time finding food lately Our biologist friend collected some data
Full Transcript
- 00:16
and we would like to put it into a frequency
- 00:19
hissed a gram because we have nothing better to do
- 00:21
with our time The data shows that five squirrels way
- 00:24
zero point five pounds seven way point five to one
- 00:27
pounds eight way One one and a half pounds Three
- 00:30
way One and half Two pounds one ways to two
- 00:32
and a half pounds and one large oval here weighs
- 00:35
three point five to four pounds This distribution of data
- 00:38
is what in squirrel ville here on here The potential
- 00:42
answers Okay so what's this question asking Well like our
- 00:47
nut loving friends over here we're going to go out
- 00:49
on a limb and say it's checking to see if
- 00:52
we know what a frequency history graham is Well if
- 00:55
we were to plot the data were given we'd have
- 00:57
a whole bunch of squirrels over here on the left
- 01:00
With big bars five of them way barely more than
- 01:03
a feather seven can register on a bathroom scale and
- 01:06
eight of them actually weigh more than a sixteen ounce
- 01:08
bottle of soda But then we get to the upper
- 01:10
weight class Just three squirrels fall in the one point
- 01:13
five two pound range and only one each fall into
- 01:16
the last two remaining boxes So while there are some
- 01:19
who are heavier it's clear that the pudgy squirrels are
- 01:22
something of an outlier and when we look at our
- 01:25
history graham well it's obvious that our data skewed right
- 01:28
Aii the bars on the right are shorter than the
- 01:31
ones on the left so our answer is be skewed
- 01:34
right Yeah well we hope some of the horizontally gifted
- 01:37
squirrels will have a heart and share their bounty with
- 01:40
the skinny minis Unfortunately we fear they'd find the mere 00:01:43.647 --> [endTime] suggestion to be well totally nuts
Up Next
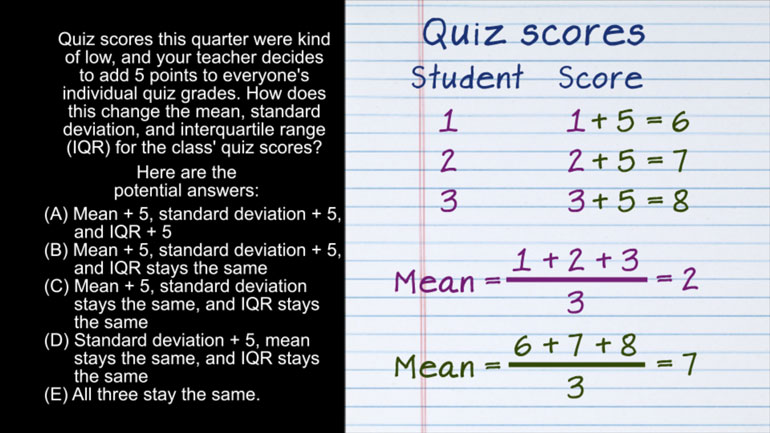
AP Statistics 2.1 Exploring Data. How does this change affect the mean, standard deviation, and IQR?
Related Videos
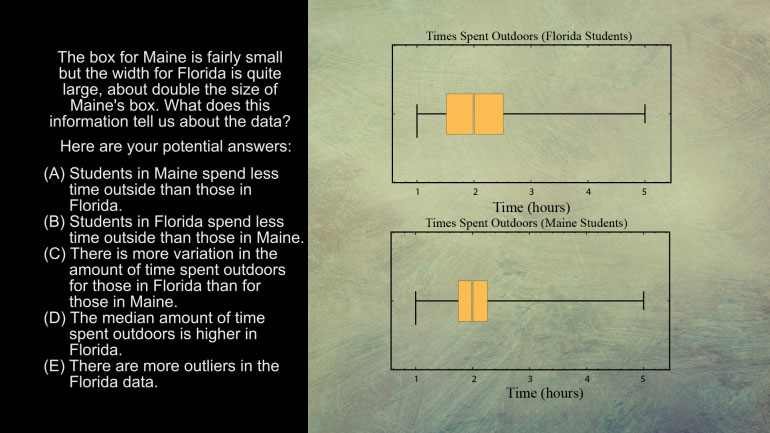
AP Statistics 5.1 Exploring Data. What does this information tell us about the data?
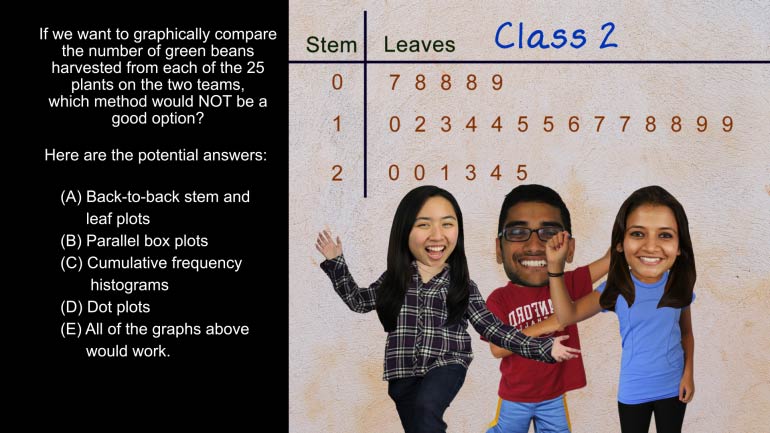
AP Statistics 5.2 Exploring Data. Which method would not be a good option?
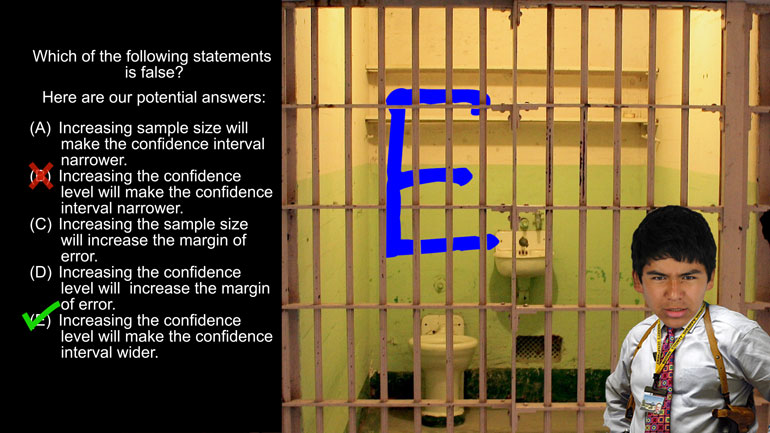
AP Statistics 1.5 Statistical Inference. Which of the following statements is false?

Want to pull an Oliver Twist and ask us for more? We've gotcha covered. Head over to /video/subjects/math/test-prep/ap-statistics/ for more AP...