ShmoopTube
Where Monty Python meets your 10th grade teacher.
Search Thousands of Shmoop Videos
AP Statistics 2.2 Exploring Data 36 Views
Share It!
Description:
AP Statistics 2.2 Exploring Data. This five-number summary indicates a distribution that is possibly...what?
Transcript
- 00:04
And here's your shmoop du jour brought to you by reality television...[television showing static]
- 00:07
We're still waiting for them to combine the bachelor with survivor, where a
- 00:11
handful of people must survive on an island having only been given a rose [people by a campfire on an island]
- 00:15
each..yeah something like that.. Okay well here we go reality television for better
- 00:20
or worse mostly worse has taken over the airwaves in the 21st century just for
Full Transcript
- 00:25
fun ish we would like to construct a box plot that displays the number of minutes
- 00:30
that adults aged 30 to 45 spent watching reality television programming in one
- 00:35
week when we said funny ish right? The minimum is zero the first quartile, q1 is
- 00:41
62 the median is 125, the q3 is 133 and the maximum is 360 this five number summary
- 00:49
indicates a distribution that is possibly what? Other than boring...
- 00:55
All right here the potential answers...[mumbling]
- 01:01
All right well let's start by visualizing this sucker here is a number line that [A number line from zero to 360]
- 01:05
goes from zero or minimum to 360 our maximum; now let's plug in what else we [person plugging in a USB stick]
- 01:11
know let's think about what we would expect these other numbers to be if
- 01:15
there was no skew at all which incidentally makes it very tricky to [man hurts himself eating a kebab]
- 01:20
make chicken kebab but okay we're going from 0 to 360 so we would expect the
- 01:25
middle value to be around half that or 180 right instead we've got 125 which
- 01:31
all things being equal should probably be a bit more to the left and then
- 01:35
there's the third quartile at 133 well that's barely more than the median [numbers on a timeline and beyonce appears]
- 01:41
meaning that even the value of q3 is one we'd expect to be a little further to
- 01:47
the left well rather than having all our numbers spread out nicely and evenly
- 01:51
they're all bunched up on one side almost as if our last piece of data [numbers bunched up close together in a room]
- 01:55
smelled bad, maybe it's time to take a hint. 360 is definitely an outlier when
- 02:00
compared to our other data points so C can't possibly be right since we aren't
- 02:05
given enough information to determine the mean we can nix D and we're told the [Girl reading a piece of paper on the wall]
- 02:09
values of both q2 the median q3 the third quartile which are close
- 02:15
in value but not quite the same, so E's out as well really all we needed to do
- 02:20
was notice that most of our data points are going to be on the left with a long
- 02:24
tail of distribution over here which means that our data is skewing right and
- 02:29
that's answer B; good thing the problem gave us all that information otherwise [Boy studying at a desk]
- 02:33
we might have been skewed...Sorry kabob humor [Man strikes the drums]
Up Next
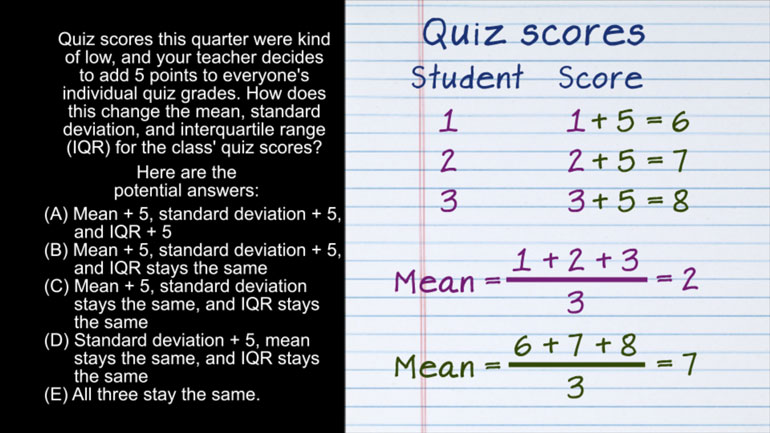
AP Statistics 2.1 Exploring Data. How does this change affect the mean, standard deviation, and IQR?
Related Videos
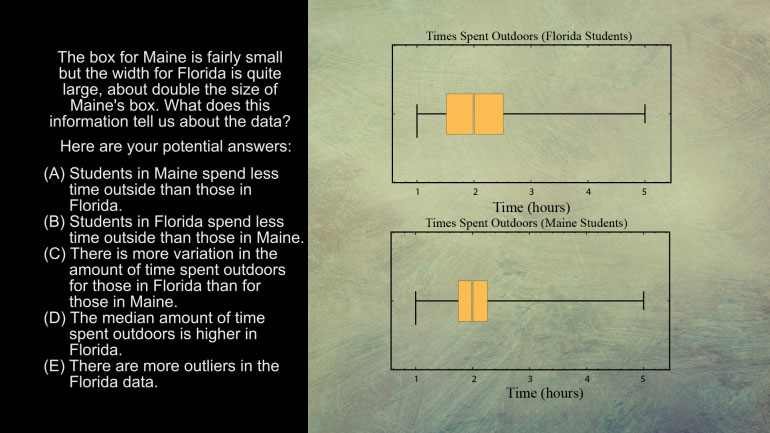
AP Statistics 5.1 Exploring Data. What does this information tell us about the data?
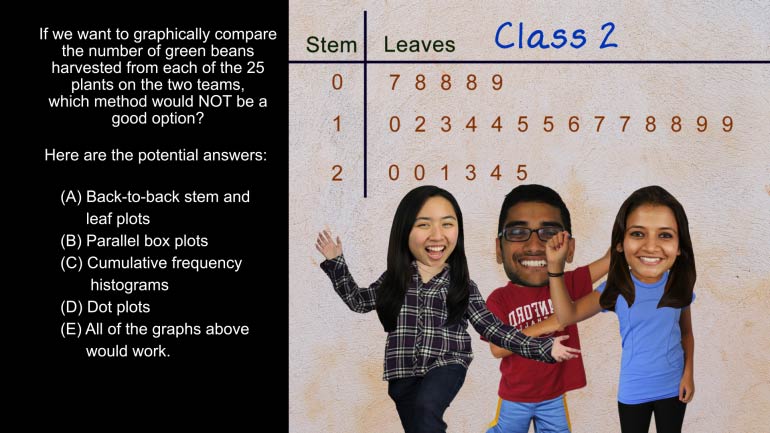
AP Statistics 5.2 Exploring Data. Which method would not be a good option?
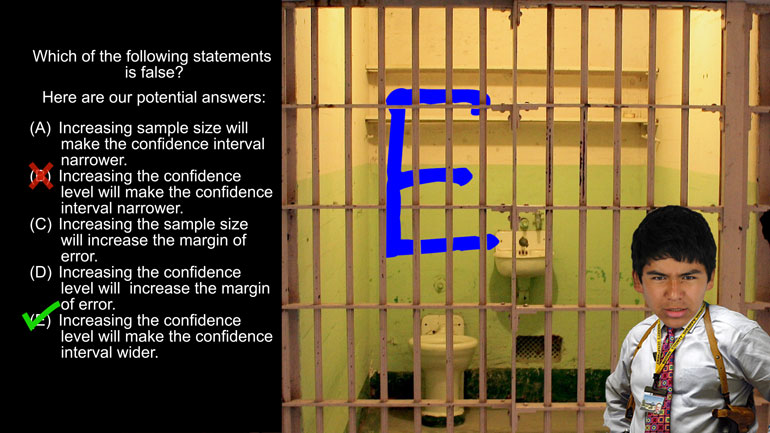
AP Statistics 1.5 Statistical Inference. Which of the following statements is false?

Want to pull an Oliver Twist and ask us for more? We've gotcha covered. Head over to /video/subjects/math/test-prep/ap-statistics/ for more AP...