ShmoopTube
Where Monty Python meets your 10th grade teacher.
Search Thousands of Shmoop Videos
AP Statistics 2.4 Exploring Data 331 Views
Share It!
Description:
AP Statistics: Exploring Data Drill 2, Problem 4. This coefficient shows a relationship of...what?
Transcript
- 00:03
Here's your shmoop du jour, brought to you by Distraction.
- 00:06
It's usually not a good thing,
- 00:07
but sometimes—OOH, LOOK, A SQUIRREL!
- 00:11
Some of us feel like we can work better with a little distraction.
- 00:14
We gathered data to see if this hypothesis was true for everyone, and graphed a scatterplot data
Full Transcript
- 00:19
showing "hours spent watching Hulu after dinner" on the x-axis and "hours of homework completed
- 00:25
after dinner" on the y-axis. We calculated a linear correlation coefficient
- 00:30
of r = -0.27. This coefficient shows a relationship of... what?
- 00:37
And here are the potential answers...
- 00:42
All we have to do is interpret the r-value to figure out whether or not the hypothesis is true.
- 00:48
Remember that r is the correlation coefficient of a set of data.
- 00:52
In other words, it tells us how good of an approximation we have.
- 00:57
In this case, we have a linear approximation, so r tells us how close to a line the data forms.
- 01:04
R values range between -1 and 1. The closer
- 01:08
r is to 0, the worse our approximation. However, as r approaches either end of its range, the
- 01:14
better the approximation. How can the correlation get better by moving
- 01:18
in either direction? Well, the more negative r is, the better a
- 01:21
negative correlation we have. The more positive, the better the positive correlation.
- 01:26
But what does THAT mean?
- 01:28
A positive correlation means that the data has a positive linear
- 01:32
slope, and a negative correlation means it has a negative linear slope.
- 01:36
We have an r value of -.27, which means there is a negative correlation.
- 01:42
Just from this knowledge, we can eliminate (A), (B), and (E).
- 01:46
-.27 is closer to 0 than -1. In other words, it's closer to having no correlation
- 01:52
than having a perfect correlation. Which means that the correlation is pretty weak.
- 01:56
Since we have a weak negative correlation,
- 01:58
our answer is (C). Even though the correlation is weak, there
- 02:01
is definitely a negative correlation... ...which means that the more Hulu you watch,
- 02:06
the less homework you'll get done.
Up Next
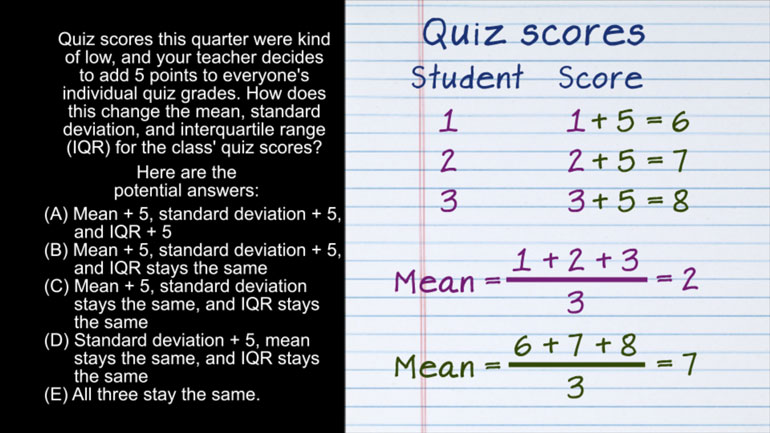
AP Statistics 2.1 Exploring Data. How does this change affect the mean, standard deviation, and IQR?
Related Videos
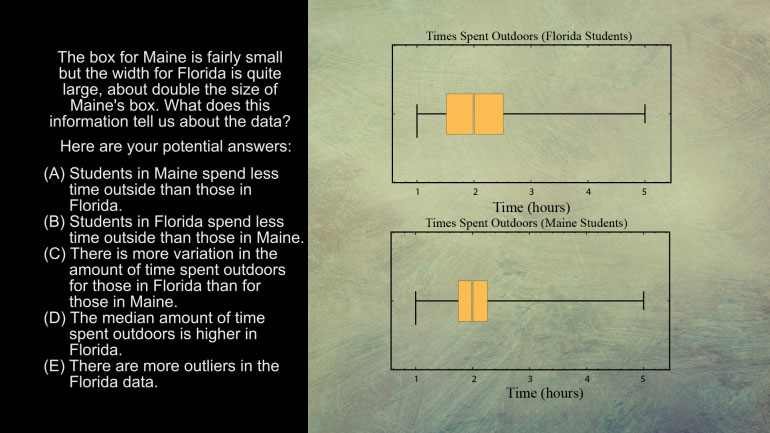
AP Statistics 5.1 Exploring Data. What does this information tell us about the data?
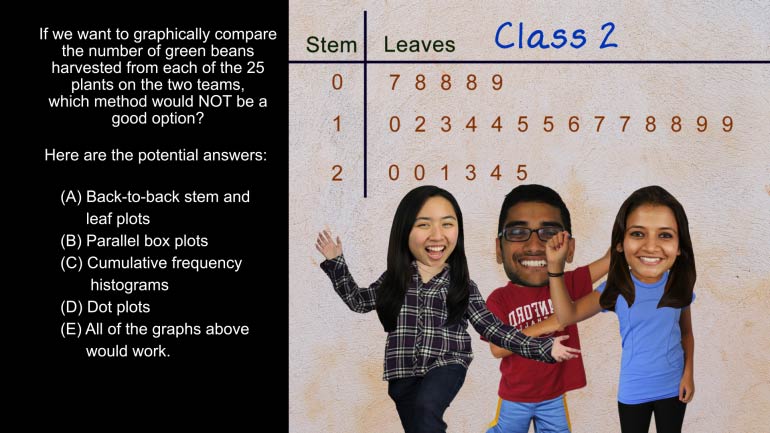
AP Statistics 5.2 Exploring Data. Which method would not be a good option?
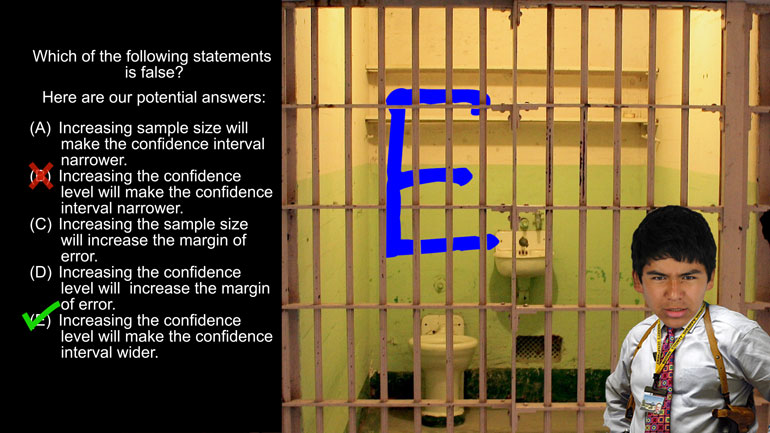
AP Statistics 1.5 Statistical Inference. Which of the following statements is false?

Want to pull an Oliver Twist and ask us for more? We've gotcha covered. Head over to /video/subjects/math/test-prep/ap-statistics/ for more AP...