ShmoopTube
Where Monty Python meets your 10th grade teacher.
Search Thousands of Shmoop Videos
AP Statistics 3.2 Exploring Data 31 Views
Share It!
Description:
AP Statistics 3.2 Exploring Data. The shape of the dot plot would be most similar to that of the what?
Transcript
- 00:04
And here's your shmoop du jour brought to you by
- 00:06
science fair the only place you'll find more volcanoes than the Hawaiian island [Kids with volcanoes at a science fair]
- 00:10
all right if we create a dot plot for the ages of students who entered the tri
- 00:15
state science fair its shape would be most similar to that of the what? ..And
- 00:20
here the potential answers and they're right here... All right this question is asking [Man sat by a grave filled with dots]
Full Transcript
- 00:27
about dot plot which is not where we bury our theater candy after its died
- 00:32
really we're just being tested to see if we know what one of these things look [A dot plot with a question mark]
- 00:36
like in action although we also need to know what these other things look like
- 00:40
because well we need to track down it's twin and without going on ancestry.com [man on a computer looking on ancestry.com]
- 00:45
that'd be cheating. The dot plot is you might guess if you didn't already know
- 00:48
it's made up of dots, but don't get it confused with a scatter plot a dot plot [A dot plot below a scatter plot]
- 00:54
displays graphical data like this where a series of results are presented in
- 00:58
random order in that they aren't sorted from high to low or from low to high so
- 01:03
great we can cross off scatter plot, oh wasn't one of the choices, aint that a kick [Girl draws a line through scatter plot and is kicked away]
- 01:08
in the pants. Well alright what are other choices well first up is cumulative
- 01:12
frequency histogram which is one of these babies it's sort of resembles a
- 01:17
dot plot except as a value shown in a cumulative frequency histogram will [A frequency histogram plot]
- 01:21
always increase from left to right so the histogram is history! What about
- 01:26
B pie chart. A dot plot has about as much in common with a pie chart [Man in the shower fully clothed]
- 01:31
as our singing voice has with Beyonce's to be fair, our shower has really...
- 01:36
all right then there's C stem and leaf plot, the word plot is in there but
- 01:42
that's where the similarities end here we have rows instead of column values [A row on a stem and leaf plot circled]
- 01:47
instead of dots, so nah we can leave C alone. Our graph does look a bit
- 01:52
like a bar graph but bar graphs are used more for showing categorical data like [A bar graph example]
- 01:58
the names of U.S. Presidents and the number of assassination attempts each had [Lincoln sat in a chair]
- 02:02
Yeah, that's a grim example, sorry but with a frequency histogram not the cumulative
- 02:08
kind you're looking at continuous data where you can have all kinds of random
- 02:12
data points that don't necessarily fit into distinct categories. So D
- 02:16
is our answer which reminds us of the D we got on our science project who knew [Boy holding up a piece of paper with a grade D]
- 02:21
dropping potassium in water would be so er, explosive oh you all knew that [Boy drops potassium in water and flames appear]
- 02:27
where were you when we needed you
Up Next
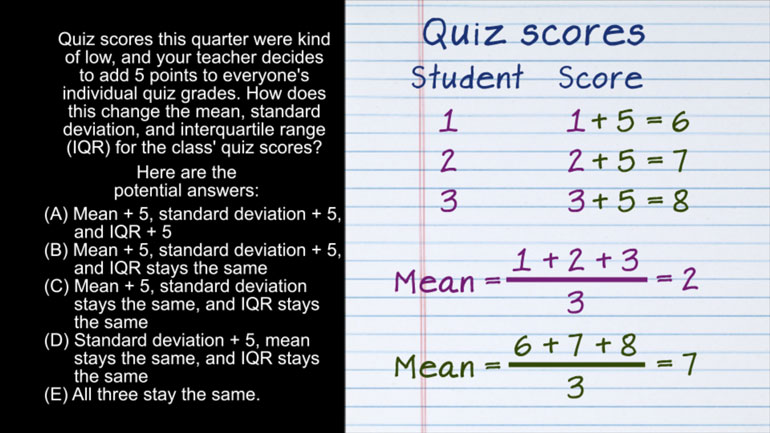
AP Statistics 2.1 Exploring Data. How does this change affect the mean, standard deviation, and IQR?
Related Videos
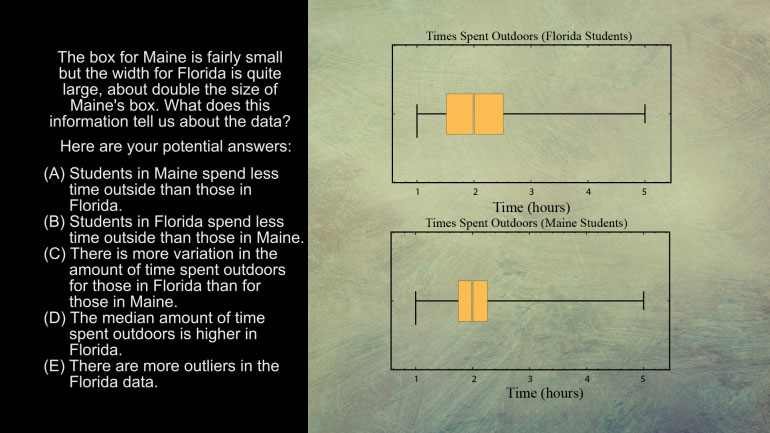
AP Statistics 5.1 Exploring Data. What does this information tell us about the data?
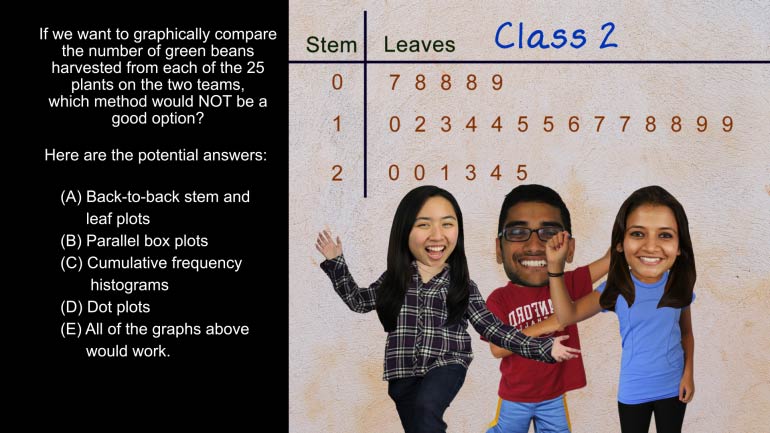
AP Statistics 5.2 Exploring Data. Which method would not be a good option?
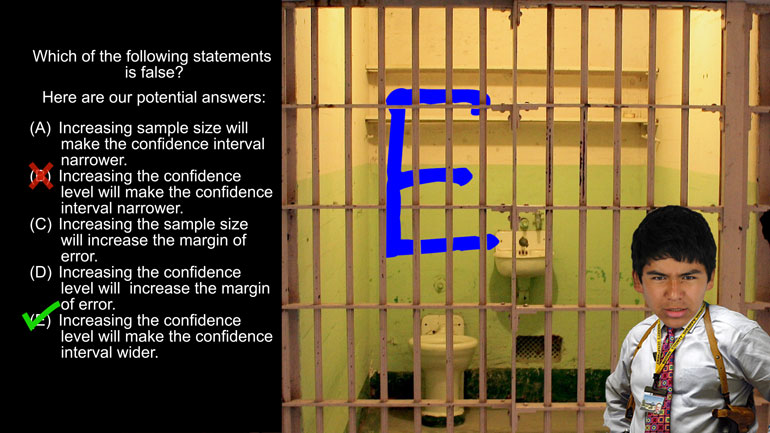
AP Statistics 1.5 Statistical Inference. Which of the following statements is false?

Want to pull an Oliver Twist and ask us for more? We've gotcha covered. Head over to /video/subjects/math/test-prep/ap-statistics/ for more AP...