ShmoopTube
Where Monty Python meets your 10th grade teacher.
Search Thousands of Shmoop Videos
AP Statistics 3.2 Statistical Inference 31 Views
Share It!
Description:
AP Statistics 3.2 Statistical Inference. What was the confidence level that the statistician used in the interval?
Transcript
- 00:04
And here's your shmoop du jour brought to you by dough..You can
- 00:07
need it or you can need it...On Sundays many people are finding their way [Child pestering Dad while on a laptop]
- 00:14
downtown to Benjamino's bakery all craving donuts the Baker at Benjamino's [People walking towards Benjamino's bakery]
- 00:20
brought in a statistician to calculate a confidence interval for the average
- 00:24
number of donuts each person bought on a Sunday. 100 people were surveyed and the
Full Transcript
- 00:29
mean number of donuts bought was 3.84 with a standard deviation of 1.12 and
- 00:34
the confidence interval he received was 3.6205 by 4.0595. What
- 00:40
was the confidence level that the statistician used in the interval? All
- 00:43
right here the potential answers....Well if you calculate using the lower limit of
- 00:50
3.6 205 the mean of 3.84 and 1.12 is the standard deviation while your formula [maths formula on a piece of paper]
- 00:57
looks like this the Z value equals 1.96 so where does that equate in the Z table
- 01:03
at the ninety percent confidence level no. Not at the 97 98 or 99 percent levels [Teacher pointing to confidence levels]
- 01:10
either that leaves B; It's a 95 percent confidence level and yeah that's
- 01:14
the correct answer once again proving that knowing your Z table like the back
- 01:18
of your hand is your avenue to success with stats. Hopefully this donut problem [Man holding hand up with Z table on his palm and kid eating a doughnut]
- 01:22
made sense to you and you're not sitting there with a glazed look in your eyes..
Up Next
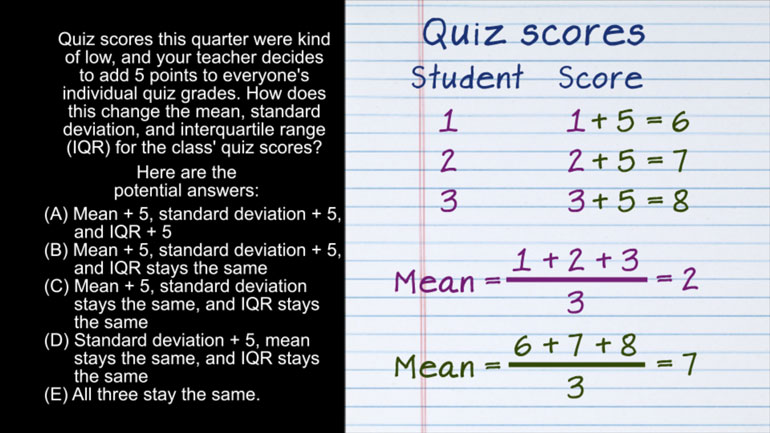
AP Statistics 2.1 Exploring Data. How does this change affect the mean, standard deviation, and IQR?
Related Videos
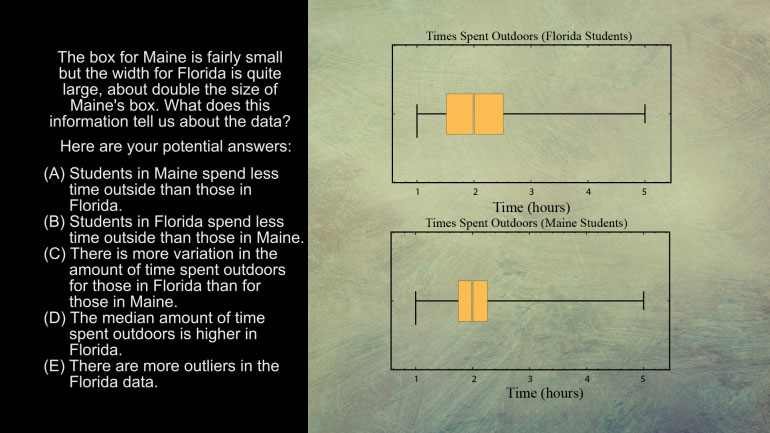
AP Statistics 5.1 Exploring Data. What does this information tell us about the data?
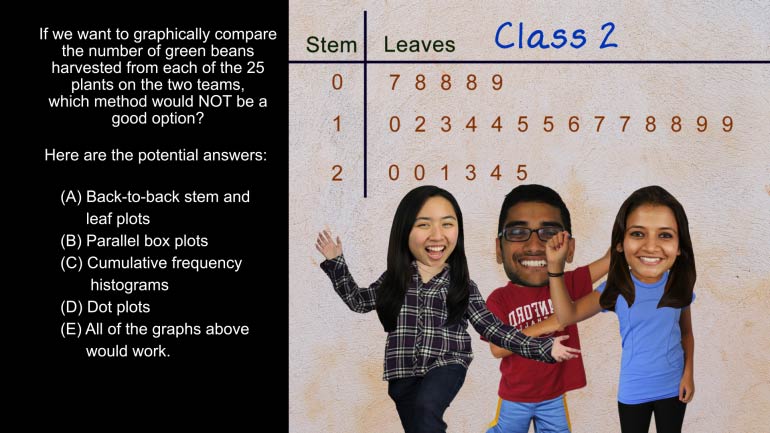
AP Statistics 5.2 Exploring Data. Which method would not be a good option?
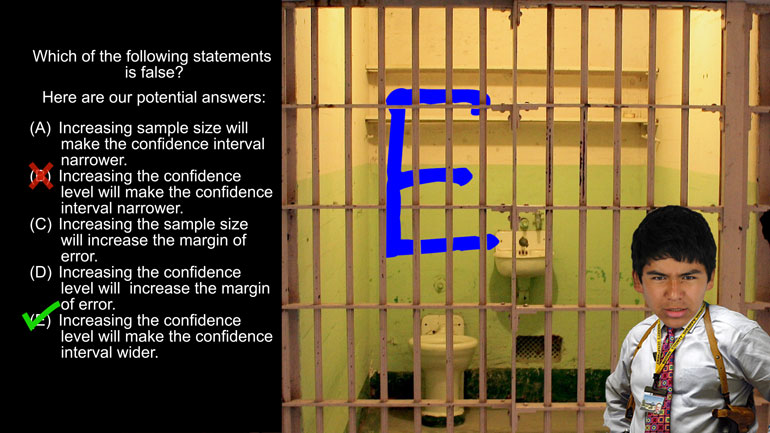
AP Statistics 1.5 Statistical Inference. Which of the following statements is false?

Want to pull an Oliver Twist and ask us for more? We've gotcha covered. Head over to /video/subjects/math/test-prep/ap-statistics/ for more AP...