ShmoopTube
Where Monty Python meets your 10th grade teacher.
Search Thousands of Shmoop Videos
AP Statistics 3.5 Statistical Inference 227 Views
Share It!
Description:
AP Statistics 3.5 Statistical Inference. To calculate a 98% confidence interval for the average number of nuts collected, we should do which of the following?
Transcript
- 00:00
Thank you We sneak and here's your smoke too Sure
- 00:05
brought to you by distraction It's usually not a good
- 00:08
thing but sometimes who Look a squirrel All right way
- 00:12
surveyed a simple random sample of twenty eights world to
- 00:14
find the average number of nuts collected before winter to
Full Transcript
- 00:18
calculate and ninety eight percent confidence interval for the average
- 00:21
number of nuts collected We should do which of the
- 00:24
following and here the financial answers Okay so what's a
- 00:29
ninety eight percent confidence interval in statistics A confidence interval
- 00:34
is an interval or range of likely population values from
- 00:37
which we might obtain our estimate of the average In
- 00:41
this case the average number of nuts collected Yeah a
- 00:44
ninety eight percent confidence interval refers to a range in
- 00:47
which we're ninety eight percent sure that the true mean
- 00:51
or average lives within those numbers Okay so first of
- 00:55
all we're calculating a confidence interval for means or averages
- 00:58
not proportions So we have to be nuts to eat
- 01:02
Picking a glance of a three day we noticed that
- 01:04
we should be solving for either the tea or than
- 01:07
see critical value which first of this year team distributions
- 01:11
when do we use the sea And when do we
- 01:12
use t Well it's actually requires us to know something
- 01:16
called the central limit Mira it tells us that the
- 01:20
sampling distribution of a sample means is approximately normal When
- 01:24
the sample size is large enough like say more than
- 01:27
thirty If our sample size is large enough we can
- 01:31
use c procedures to analyze samples If not we have
- 01:34
to use t procedure Okay in this case our sample
- 01:38
size is not large enough so we have to use
- 01:40
t procedures which leaves us with your b or c
- 01:43
is the answer all right A little bit about the
- 01:46
team distribution The tea distribution changes based on sample size
- 01:50
and is determined by the number of degrees of freedom
- 01:53
which is basically just the sample size and minus one
- 01:56
closer end is two Thirty the more it looks normal
- 02:00
like ze distribution with our sample size of twenty eight
- 02:03
squirrels the degrees of freedom or df is twenty eight
- 02:07
minus one or twenty seven We're looking for a ninety
- 02:10
eight percent confidence level So if we shade in the
- 02:14
middle of the distribution is ninety eight percent We're left
- 02:17
With two talents of one percent or point o one
- 02:22
though the tea distribution table which is provided in every
- 02:24
stats test shows us that thi equals two point four
- 02:26
seven three for ninety eight percent Confidence level and bf
- 02:31
equals twenty seven And today our answer is c
Up Next
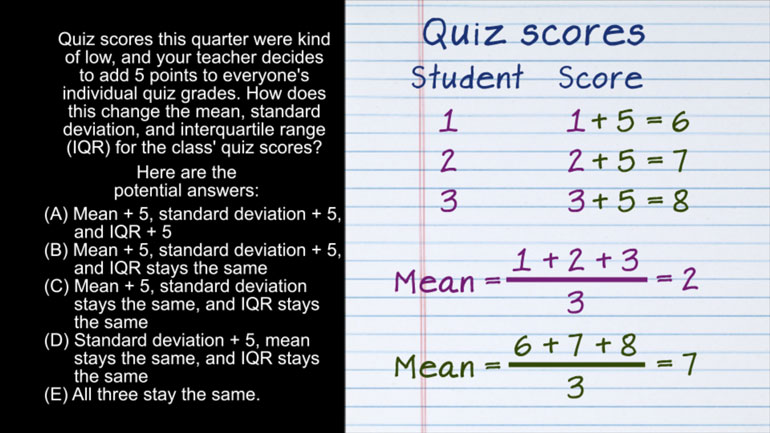
AP Statistics 2.1 Exploring Data. How does this change affect the mean, standard deviation, and IQR?
Related Videos
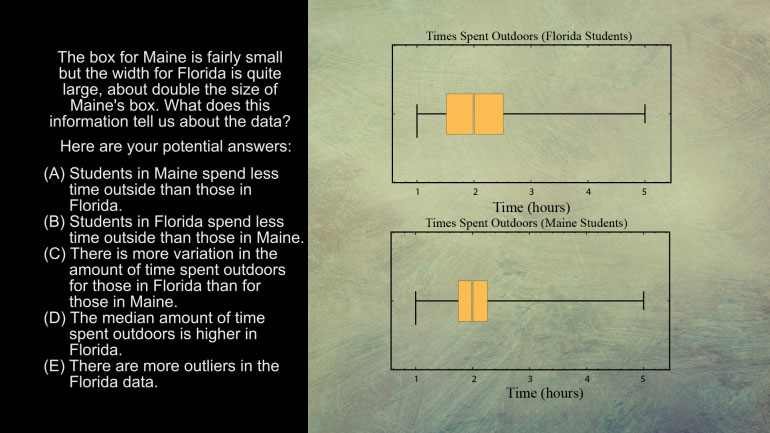
AP Statistics 5.1 Exploring Data. What does this information tell us about the data?
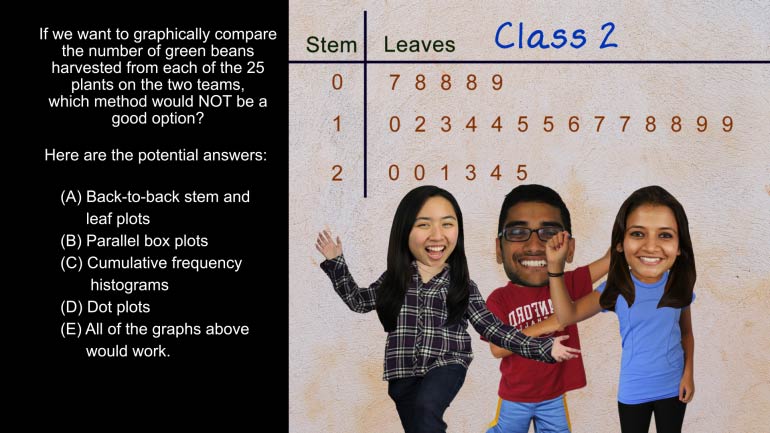
AP Statistics 5.2 Exploring Data. Which method would not be a good option?
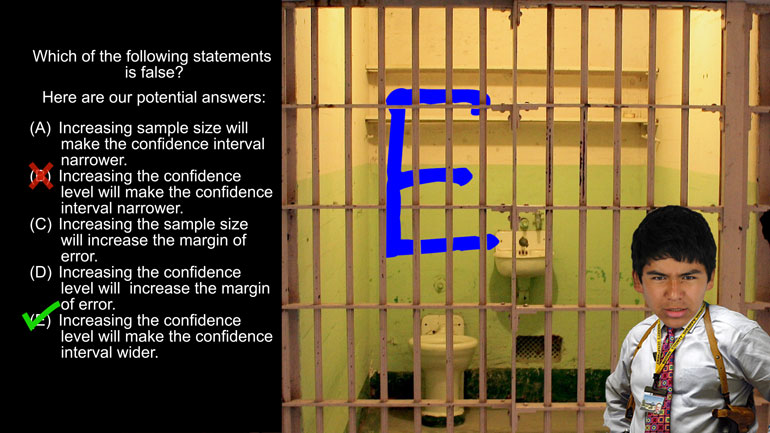
AP Statistics 1.5 Statistical Inference. Which of the following statements is false?

Want to pull an Oliver Twist and ask us for more? We've gotcha covered. Head over to /video/subjects/math/test-prep/ap-statistics/ for more AP...