ShmoopTube
Where Monty Python meets your 10th grade teacher.
Search Thousands of Shmoop Videos
AP Statistics 1.4 Statistical Inference 201 Views
Share It!
Description:
AP Statistics 1.4 Statistical Inference. What is the 99% confidence interval for the dogs' biscuit consumption?
Transcript
- 00:00
Thank you We sneak and here's your shmoop du jour
- 00:05
brought to you by fancy pants canines They desire the
- 00:08
finer things in life and it's a pity they have
- 00:10
to settle for us Here's the question A simple random
- 00:15
sample of three hundred poodles is taken from a population
Full Transcript
- 00:18
of two thousand poodles in the samples The average number
- 00:21
of fancy pants canine biscuits eaten per day was three
- 00:23
point eight with a standard deviation of one point one
- 00:26
What is the ninety nine percent confidence interval for the
- 00:29
dog's biscuit consumption And here the possible answers All right
- 00:33
three point eight plus or minus what Okay well let's
- 00:36
walk through this and be sure to keep muttering to
- 00:38
yourself that there's nothing you'd rather be doing at this
- 00:40
moment than working with statistical inference muttering that makes it
- 00:44
harder to screen All right we need a confidence interval
- 00:47
for a mean so we need to know if the
- 00:49
sample is a simple random sample With means yes but
- 00:54
we don't think dogs even know how to say no
- 00:58
No way Okay next Is the population normally distributed with
- 01:03
a sample size of thirty or more Yeah Sample sizes
- 01:06
three hundred so slightly bigger than thirty How about the
- 01:09
standard deviation P no dice It wasn't given and we
- 01:13
have no way of calculating it So we'll calculate the
- 01:16
confidence interval like this sample estimate plus or minus critical
- 01:20
value times standard deviation of the estimate Since we were
- 01:25
never given p which is still a sore spot for
- 01:28
us we must use tea instead of ze since p
- 01:31
is unknown So our equation looks like this This ugly
- 01:35
thing right there the calculate t look at the t
- 01:38
distribution table that's the chart with all the columns and
- 01:41
all the numbers Once your eyes adjust focus on the
- 01:44
column with the ninety nine percent of the bottom There
- 01:46
are three hundred minus one degrees of freedom otherwise known
- 01:50
as two hundred ninety nine Since the table doesn't give
- 01:53
us two ninety nine we have to use the closest
- 01:55
number below two ninety nine which is one hundred So
- 01:59
the info that we've gathered calculated and otherwise bemoan gives
- 02:02
us t equals two point six two six which we
- 02:06
can plug into our equation and we get three point
- 02:08
eight plus or minus zero point one six seven And
- 02:12
what do you know that looks familiar Answer D is
- 02:15
the correct choice And hey if you want to impress
- 02:17
your fancy pants canine try explaining statistical inference to him
- 02:21
So they probably already learned it during their time at 00:02:23.84 --> [endTime] harvard
Up Next
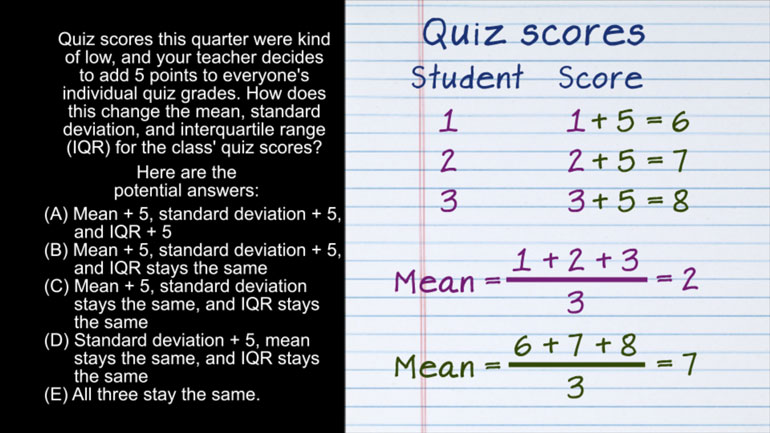
AP Statistics 2.1 Exploring Data. How does this change affect the mean, standard deviation, and IQR?
Related Videos
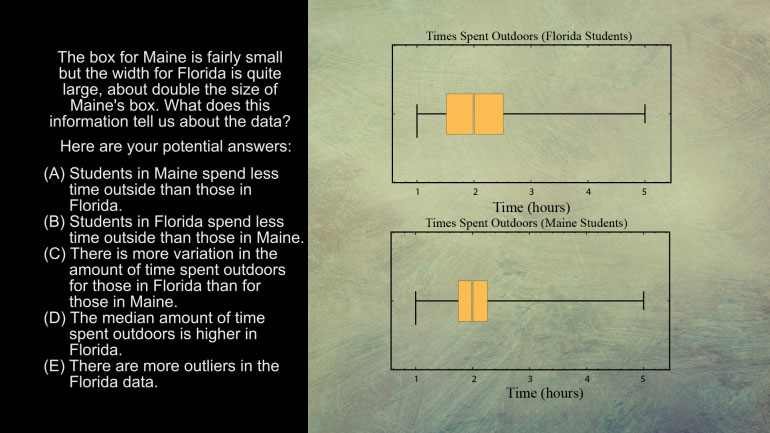
AP Statistics 5.1 Exploring Data. What does this information tell us about the data?
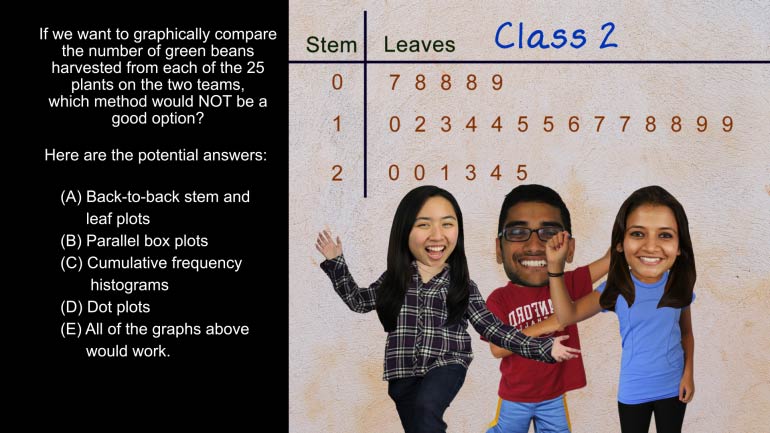
AP Statistics 5.2 Exploring Data. Which method would not be a good option?
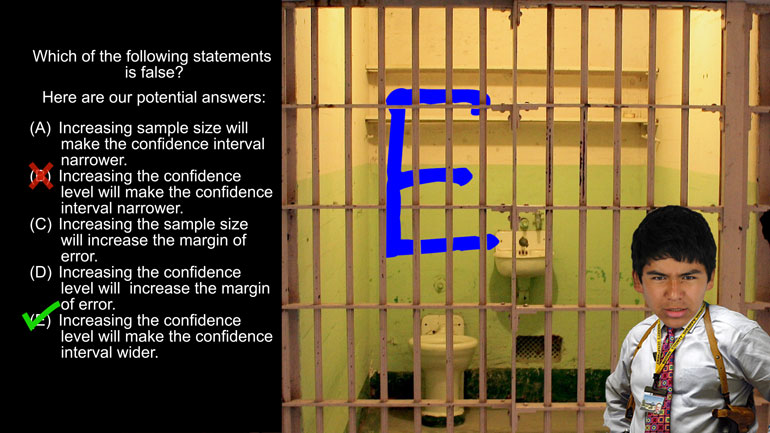
AP Statistics 1.5 Statistical Inference. Which of the following statements is false?

Want to pull an Oliver Twist and ask us for more? We've gotcha covered. Head over to /video/subjects/math/test-prep/ap-statistics/ for more AP...