ShmoopTube
Where Monty Python meets your 10th grade teacher.
Search Thousands of Shmoop Videos
Charts, Graphs, and Tables Videos 60 videos


This video covers how to set up a stem and leaf plot and use it to find the mean and median of a set of numbers.


Knock-Knock. ¡Histograma cantante! Aquí para cantarte a tí acerca de toda la alegría y maravillas de lo que hacemos. ¿Te interesaría adquirir...
CAHSEE Math 4.4 Statistics, Data, and Probability II 174 Views
Share It!
Description:
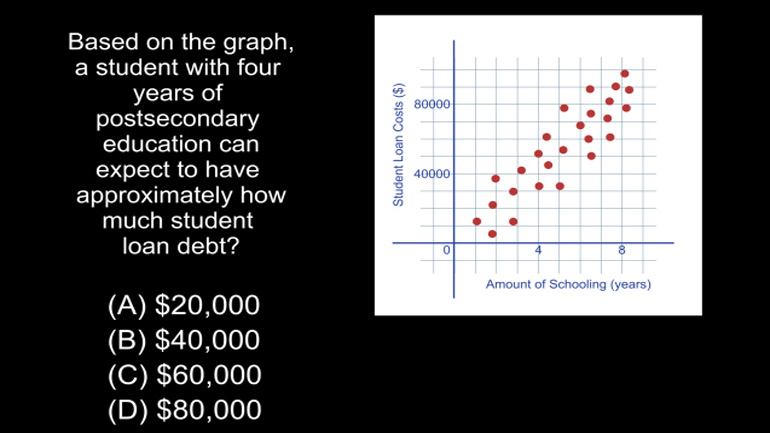
Statistics, Data, and Probability II Drill 4 Problem 4. Based on the graph, a student with four years of postsecondary education can expect to have approximately how much student loan debt?
Transcript
- 00:03
Shmoop-oop-a-doop-boop… boop-boop!
- 00:09
You might want to turn on all the lights and grab a friend for this one…
- 00:12
hang on for a truly terrifying question…
- 00:15
The following plot shows the relationship between the amount of postsecondary education
- 00:19
and the amount of student loan debt for several students.
Full Transcript
- 00:23
Based on the graph, a student with four years
- 00:25
of postsecondary education can expect to have approximately how much student loan debt?
- 00:30
And here are the potential answers...
- 00:39
This question is all about… simply reading a graph – or at least a pimply set of dots.
- 00:44
If you go over to 4 on the x-axis and then crawl upwards so you’re in the middle of
- 00:49
where most of those dots hover, you get to about $40,000.
- 00:53
The BEST answer definitely ISN'T 20, 60 or 80 grand… so 40 has to be the right answer.
- 01:00
And it is. B's our guy.
- 01:02
Of course, the numbers in this chart are merely for the purposes of the problem at hand.
- 01:06
In reality… be prepared to spend $40,000 on textbooks…
- 01:10
Or instead, go and see the kindly, loving people at Chegg!
Related Videos

CAHSEE Math: Algebra and Functions Drill 5, Problem 3. Solve the equation.


Statistics, Data, and Probability I: Drill Set 3, Problem 4. How many different avatars can be created based on the given options?

Statistics, Data, and Probability II Drill 3 Problem 2. Which two sports together make up for the preferences of more than half of all those w...

Statistics, Data, and Probability II Drill 3 Problem 3. One hundred twenty of those who were asked preferred what sport?