ShmoopTube
Where Monty Python meets your 10th grade teacher.
Search Thousands of Shmoop Videos
Charts, Graphs, and Tables Videos 60 videos


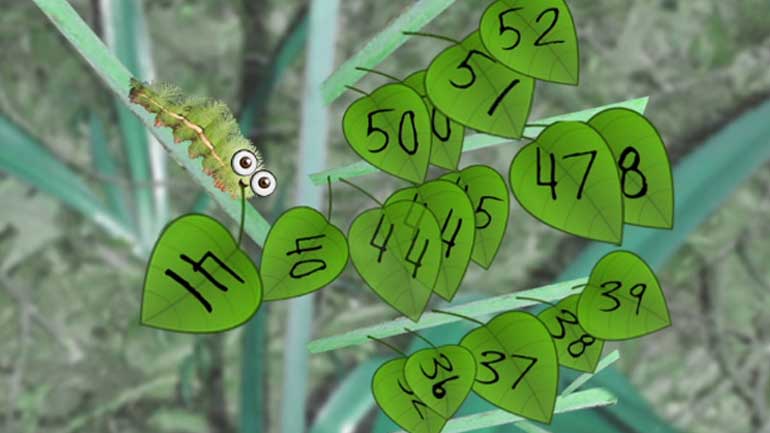
This video covers how to set up a stem and leaf plot and use it to find the mean and median of a set of numbers.


Knock-Knock. ¡Histograma cantante! Aquí para cantarte a tí acerca de toda la alegría y maravillas de lo que hacemos. ¿Te interesaría adquirir...
CAHSEE Math 5.1 Statistics, Data, and Probability II 168 Views
Share It!
Description:
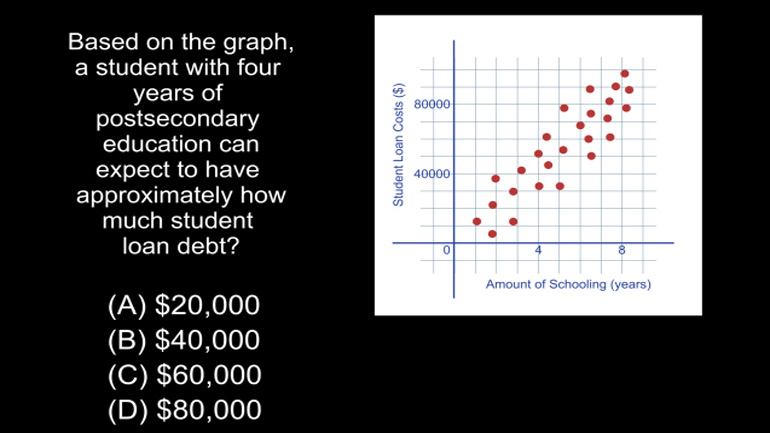
Statistics, Data, and Probability II Drill 5 Problem 1. Based on the data, a student who had missed 10 days of school can expect his GPA to be about what?
Transcript
- 00:03
Here’s a question you can really shmoop to…
- 00:05
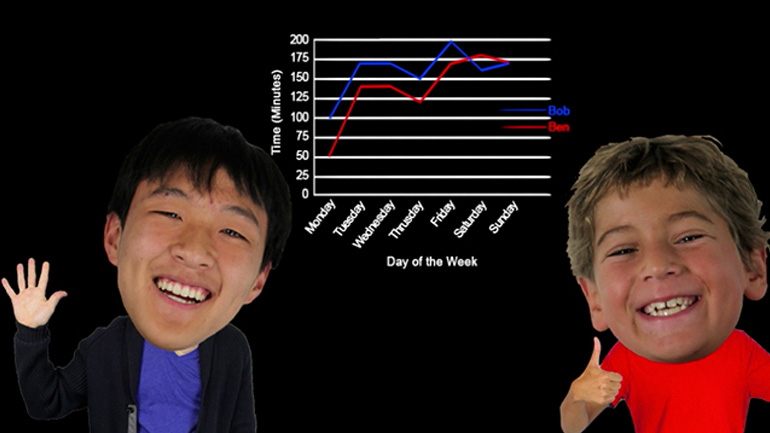
Edgar has made a shocking, controversial claim
- 00:08
– that more time spent in school means better grades. Wow. Really going out on a limb there, eh, Eddie?
- 00:14
He conducted a survey asking students about
- 00:16
the number of days that they were absent in a semester, and their semester GPAs.
Full Transcript
- 00:21
The results are shown in the plot below. Based on this, a student who had missed 10
- 00:26
days of school can expect his GPA to be about… what?
- 00:30
And here are the potential answers...
- 00:39
The data isn’t all that surprising.
- 00:41
Huck Finn, king of the hookey-players, wasn’t exactly valedictorian material.
- 00:46
So a kid who has missed 10 days – right here on the x axis - would expect a GPA of
- 00:50
about 2.0 if we draw the line right up here into this… red dot cloud of confusion.
- 00:59
So… our answer is B.
- 01:00
Which was, incidentally, the best score Huck ever got on a report card.
Related Videos

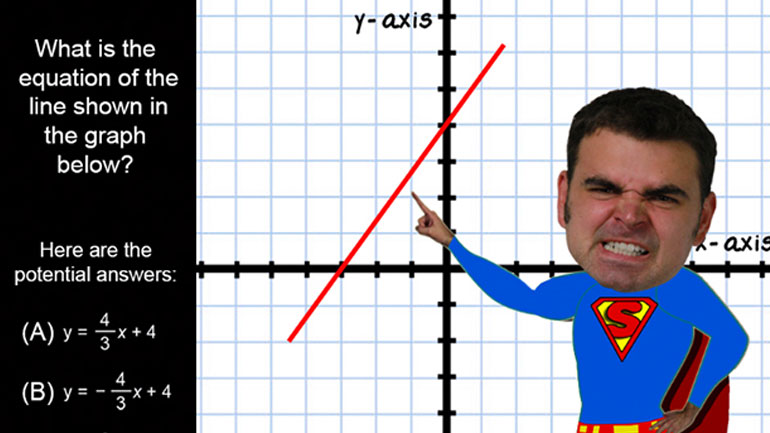
CAHSEE Math: Algebra and Functions Drill 5, Problem 3. Solve the equation.


Statistics, Data, and Probability I: Drill Set 3, Problem 4. How many different avatars can be created based on the given options?

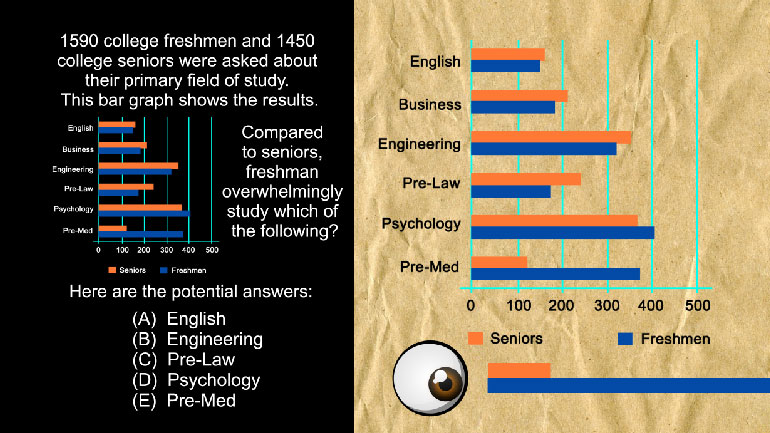
Statistics, Data, and Probability II Drill 3 Problem 2. Which two sports together make up for the preferences of more than half of all those w...

Statistics, Data, and Probability II Drill 3 Problem 3. One hundred twenty of those who were asked preferred what sport?