ShmoopTube
Where Monty Python meets your 10th grade teacher.
Search Thousands of Shmoop Videos
Statistics and Probability Videos 134 videos


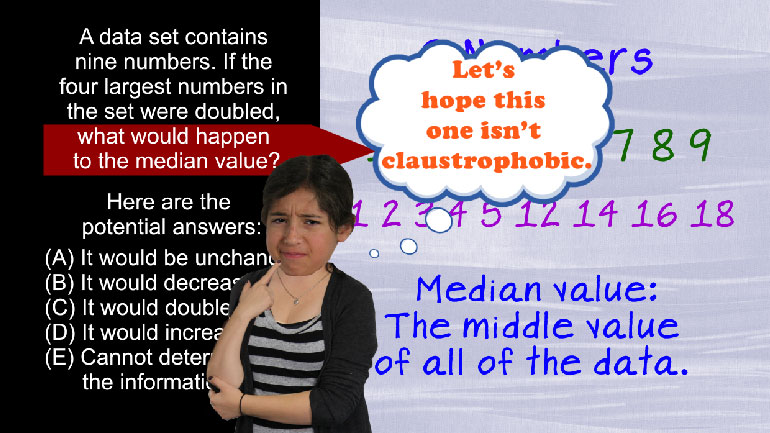
SAT Math: Statistics and Probability Drill 1, Problem 2. If the four largest numbers in the set were doubled, what would happen to the median...
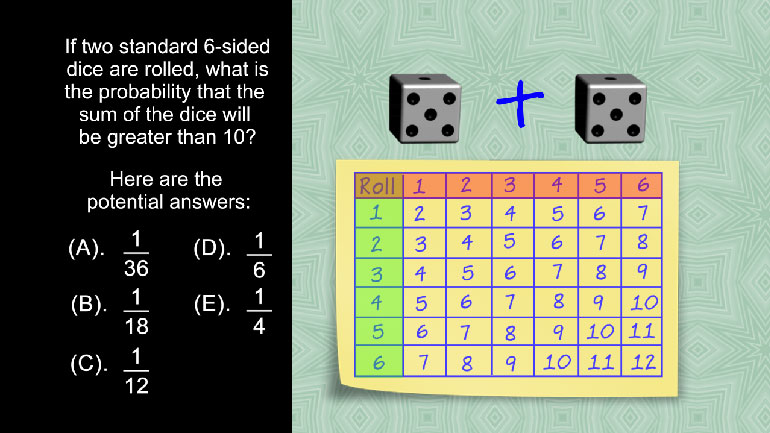
SAT Math 1.4 Statistics and Probability. If two standard 6-sided dice are rolled, what is the probability that the sum of the dice will be gre...

SAT Math 1.5 Statistics and Probability. If Silas draws one card, then places it in his pocket and draws another, what is the probability that...
CAHSEE Math 2.1 Statistics, Data, and Probability II 178 Views
Share It!
Description:
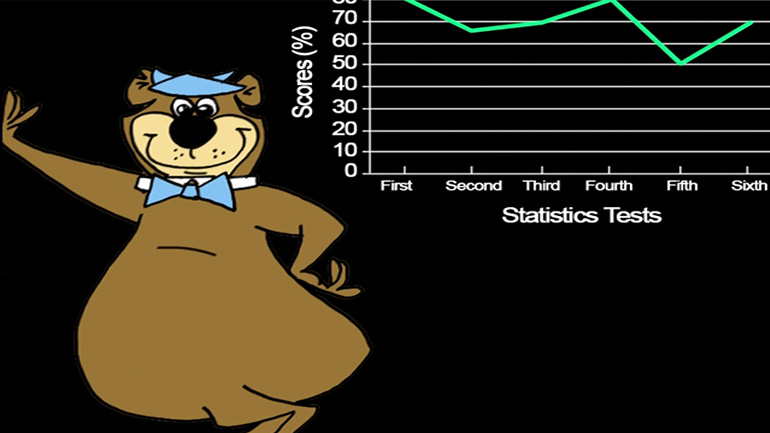
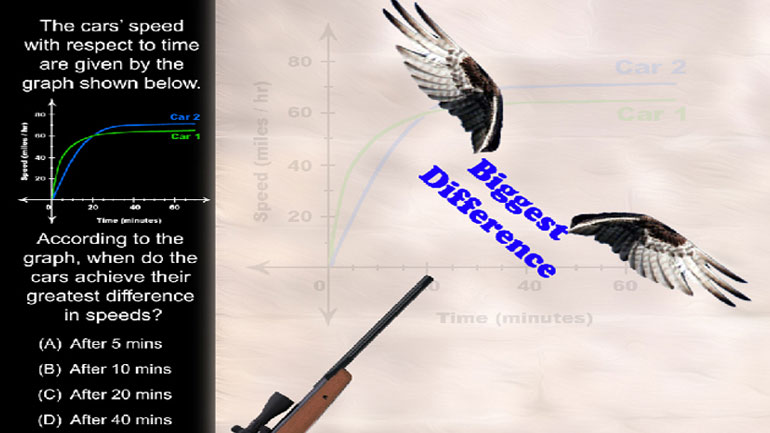
Statistics, Data, and Probability II Drill 2 Problem 1. Yogi's rate of success increased the most from when to when?
Transcript
- 00:03
This question is shmoopier than the average bear…
- 00:08
Yogi Bear has been tracking his picnic basket-stealing rate of success
- 00:11
for each of the first six months of the year.
- 00:14
The following graph shows how Yogi fared in each of those months.
- 00:18
Yogi’s rate of success increased the most from… when to when?
Full Transcript
- 00:23
And here are the potential answers…
- 00:27
Ok so this question is asking about relative growth rates and it is asking us to calculate
- 00:32
from one period to the next.
- 00:34
Note that the answer set doesn’t even include the first period so we can ignore it.
- 00:39
Best way to start is to just make a quick table.
- 00:43
Sit at it, take out our notebook and pen.
- 00:46
And then make this kind of table:
- 00:48
Second: 65
- 00:50
Third: 70
- 00:51
Fourth: 80
- 00:52
Fifth: 50
- 00:53
Sixth: 70 Well just visually we can tell that the steepest
- 00:57
increase is from 5 to 6 but to be hugely sure we’re right…
- 01:02
…we can just apply the formula NEW MINUS OLD OVER OLD to each of the choices.
- 01:08
For A, it looks like this: 70 – 65 over 65 and the growth rate is 5 over 65 or just 7.7%.
- 01:19
For B, we grow from 70 to 80 or 10 units and
- 01:22
get 10 over 70 or a rate of 14.3%.
- 01:28
For answer choice C, we grow from 4 to 5 which
- 01:31
is actually SHRINKAGE so we can just toss it – no growth.
- 01:35
Answer D goes from 50 to 70 or a growth amount of 20 – 20 over 50 is 40 per cent which
- 01:41
just smokes everything else.
- 01:45
So the answer is D.
- 01:46
As in… “Darn that Ranger Smith…”
Related Videos

CAHSEE Math: Algebra and Functions Drill 5, Problem 3. Solve the equation.

Statistics, Data, and Probability I: Drill Set 1, Problem 1. What is the mean yearly salary?

Statistics, Data, and Probability I: Drill Set 1, Problem 2. What is the median length of these writing utensils?

CAHSEE Math Statistics, Data, and Probability I: Drill Set 1, Problem 3. The mode of the number of days in each month for a single non-leap year is...

Statistics, Data, and Probability I: Drill Set 1, Problem 4. How old was the final person to join?