ShmoopTube
Where Monty Python meets your 10th grade teacher.
Search Thousands of Shmoop Videos
Statistics and Probability Videos 134 videos


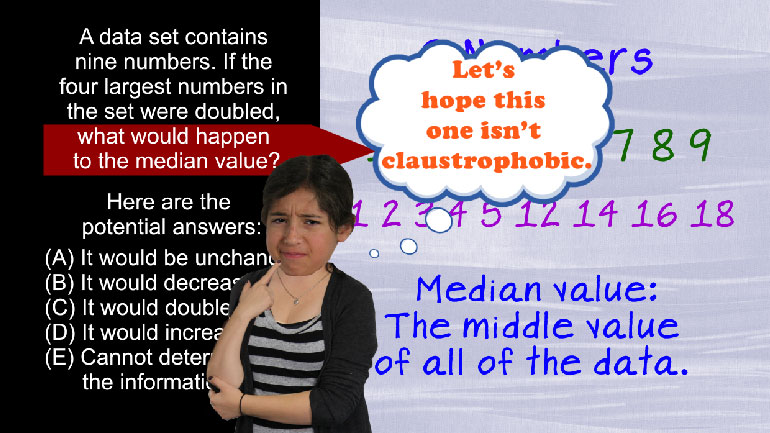
SAT Math: Statistics and Probability Drill 1, Problem 2. If the four largest numbers in the set were doubled, what would happen to the median...

SAT Math 1.4 Statistics and Probability. If two standard 6-sided dice are rolled, what is the probability that the sum of the dice will be gre...

SAT Math 1.5 Statistics and Probability. If Silas draws one card, then places it in his pocket and draws another, what is the probability that...
CAHSEE Math 4.3 Statistics, Data, and Probability II 172 Views
Share It!
Description:
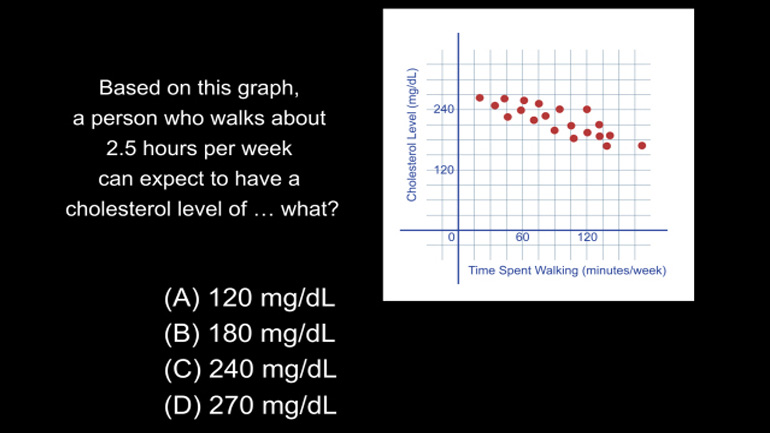
Statistics, Data, and Probability II Drill 4 Problem 3. Based on this graph, a person who walks about 2.5 hours per week can expect to have a cholesterol level of what?
Transcript
- 00:03
And here's another shmoopy question for ya.
- 00:06
The following graph shows points representing the relationship between the amount of time
- 00:09
spent walking per week and cholesterol levels of various people.
- 00:12
The people who don’t walk at all… are on an entirely different, much more depressing graph.
- 00:17
Based on this graph, a person who walks about 2.5 hours per week can expect
Full Transcript
- 00:21
to have a cholesterol level of… what?
- 00:25
And here are the potential answers...
- 00:33
Scatter plot question. These are all about just making educated guesses.
- 00:37
Emphasis on… educated.
- 00:40
First let’s find the key points – the question asks about what happens after 2 and
- 00:44
a half hours or 150 minutes of walking…
- 00:47
…so we get a line starting here… as each block is 15 minutes.
- 00:52
If we draw the line upwards, we cross dots around here…
- 00:55
…so if we draw a horizontal line back to the y-axis…
- 00:58
…we get to a spot about half way between 120 and 240
- 01:02
or at about the 180 milligrams per deciliter line.
- 01:05
So the answer is B.
- 01:07
As in… “Butter pecan.”
Related Videos

Statistics, Data, and Probability II Drill 3 Problem 2. Which two sports together make up for the preferences of more than half of all those w...

Statistics, Data, and Probability II Drill 3 Problem 3. One hundred twenty of those who were asked preferred what sport?

CAHSEE Math: Algebra and Functions Drill 5, Problem 3. Solve the equation.


Statistics, Data, and Probability I: Drill Set 3, Problem 4. How many different avatars can be created based on the given options?