ShmoopTube
Where Monty Python meets your 10th grade teacher.
Search Thousands of Shmoop Videos
Interpreting Categorical and Quantitive Data Videos 17 videos


Data doesn't do us much good if we can't interpret it. Ever snuck into a CPA's office while he slips out for a coffee break and tried to decipher o...

Statistics, Data, and Probability I: Drill Set 3, Problem 4. How many different avatars can be created based on the given options?

Statistics, Data, and Probability I: Drill Set 3, Problem 5. What is the probability that the sum of the two rolls adds up to 9?
TSI Math: Finding the Approximate Slope of a Scatterplot 17 Views
Share It!
Description:
Each minute of studying increased Wendy's quiz grade by approximately how many points?
- Data Analysis, Statistics, and Probability / Interpreting Categorical and Quantitative Data
- Data Analysis, Statistics, and Probability / Interpreting Categorical and Quantitative Data
- TSI Math / Data Analysis, Statistics, and Probability
- Test Prep / TSI
- TSI Mathematics / Data Analysis, Statistics, and Probability
- TSI / TSI Math
- TSI / TSI Mathematics
- Test Prep / TSI
Transcript
- 00:02
All right sy math shmoop ing people interpreting categorical and
- 00:06
quantitative data statistical measures That was the original title of
- 00:10
harry potter Actually a lot of people don't know that
- 00:12
okay the question when he has a quiz in math
- 00:15
class every day for the past ten days she has
Full Transcript
- 00:18
kept track of her quiz grade and the amount of
- 00:20
time she studied the day before the data she collected
- 00:23
is shown in a scatter plot below Right here this
- 00:25
thing Use the information answer the next to question So
- 00:28
here we go Each minute of studying increased wendy's quiz
- 00:32
grade by approximately how many points Well wendy seems to
- 00:38
be ah studying pro here really If a minute of
- 00:41
studying increases their grade by ex points while then we
- 00:44
could say that studying increases her grade at a rate
- 00:47
of x points per minute Not coincidentally that second phrasing
- 00:51
sounds an awful lot like a description of slope The
- 00:54
rate of vertical change points per unit of horizontal change
- 00:58
one minute Imagine drawing a line through the data and
- 01:01
estimating and well the slope of that line Let's do
- 01:04
that so we can't calculate the exact slope of the
- 01:06
line to best fit Yet here to estimate it our
- 01:09
best bet is to use wendy's lowest and highest scores
- 01:12
We got ten minutes of studying earned wendy thirty points
- 01:15
and sixty minutes of studying earned her a hundred points
- 01:18
well increasing her study time by sixty minus ten or
- 01:22
fifty minutes increased her score by one hundred minus thirty
- 01:25
is seventy points right So slope is the vertical change
- 01:29
over the horizontal change or seventy points is to fifty
- 01:32
minutes or seven Fists are one point four points per
- 01:36
minute So each minute of studying increased wendy's grade by
- 01:39
about one point Four points Yeah The answer is b
- 01:43
and ah mei You do the same on shmoop please 00:01:46.087 --> [endTime] And then you know tell us about it
Related Videos
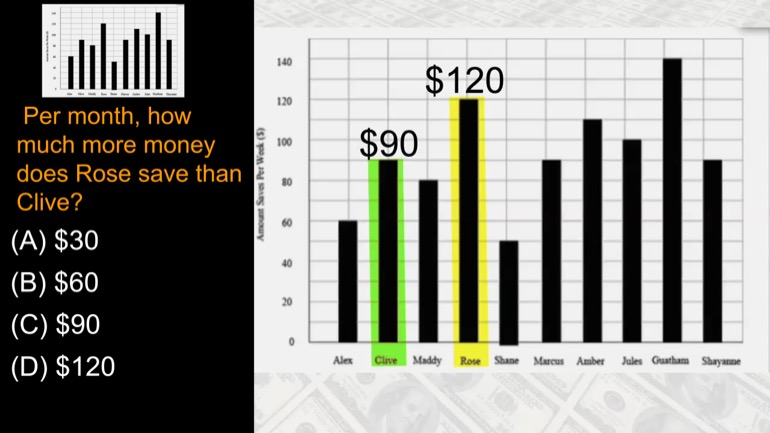
Per month, how much more money does Rose save than Olive?
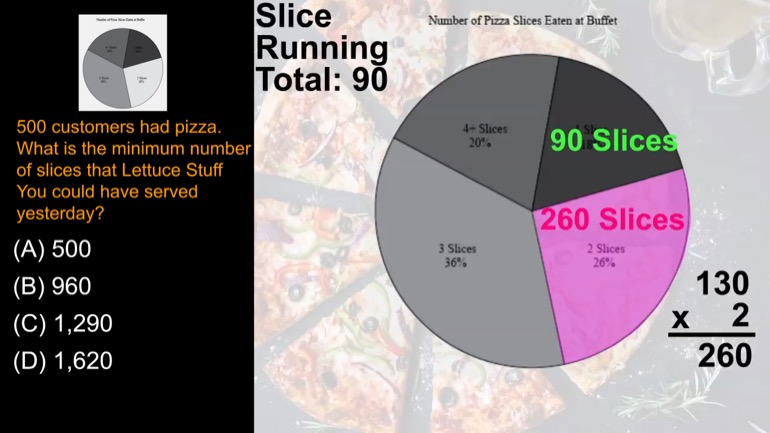
500 customers had pizza. What is the minimum number of slices that Lettuce Stuff You could have served yesterday?

The following table shows the coffee preferences of everyone in Isabelle's office. What percentage of Isabelle's coworkers put cream in their coffee?
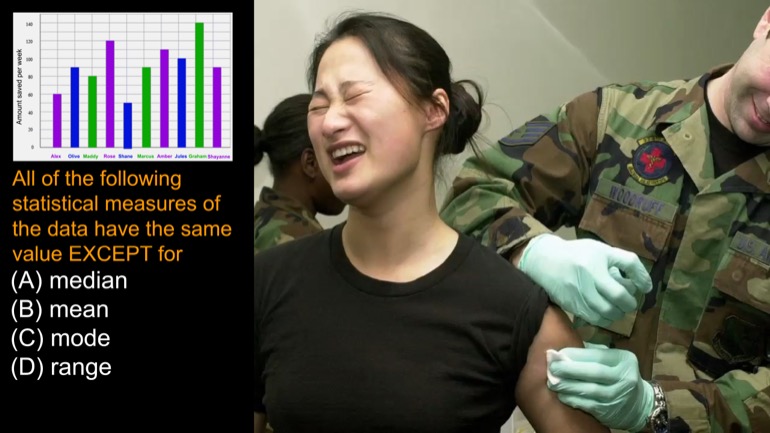
All of the following statistical measures of the data above have the same value EXCEPT for
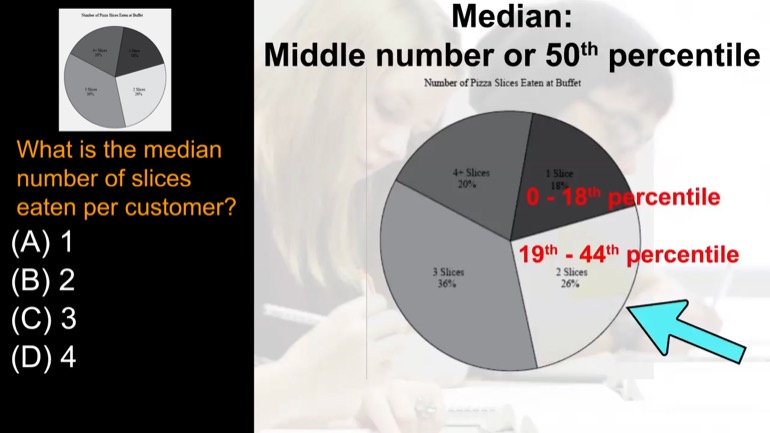
What is the median number of slices eaten per customer?