ShmoopTube
Where Monty Python meets your 10th grade teacher.
Search Thousands of Shmoop Videos
Interpreting Categorical and Quantitive Data Videos 17 videos


Data doesn't do us much good if we can't interpret it. Ever snuck into a CPA's office while he slips out for a coffee break and tried to decipher o...

Statistics, Data, and Probability I: Drill Set 3, Problem 4. How many different avatars can be created based on the given options?

Statistics, Data, and Probability I: Drill Set 3, Problem 5. What is the probability that the sum of the two rolls adds up to 9?
TSI Math: Working with the Standard Deviation Formula 18 Views
Share It!
Description:
Using the formula for standard deviation
 , find s for the following set of data:
0, 8, 9, 13, 14
- Data Analysis, Statistics, and Probability / Interpreting Categorical and Quantitative Data
- Data Analysis, Statistics, and Probability / Interpreting Categorical and Quantitative Data
- TSI Math / Data Analysis, Statistics, and Probability
- Test Prep / TSI
- TSI Mathematics / Data Analysis, Statistics, and Probability
- TSI / TSI Math
- TSI / TSI Mathematics
- Test Prep / TSI
Transcript
- 00:02
All right see math Shmoop er's We've got some standard
- 00:05
deviants for you using the formula for standard deviation What
- 00:09
is this find asked for the following set of data
- 00:17
Okay big breath We're being asked to turn the crank
- 00:20
by hand on the standard deviation machine What goes on
Full Transcript
- 00:24
inside that machine between when we dumped the numbers in
- 00:27
and we get the result after turning the crank a
- 00:30
few times Well the machine looks something like this and
- 00:33
let's Take off the side pale and put our mitts
- 00:37
on and peek inside at the guts of the machine
- 00:40
All the goopy stuff way start off by finding the
- 00:43
mean that's His acts with the line over it will
- 00:46
some the values and divide by five So how do
- 00:49
we do that We got zero eight nine thirteen fourteen
- 00:51
We divide by five Forty for over five That's eight
- 00:54
point eight Well now we need to take each data
- 00:56
point Subtract the mean from them So that's the x
- 00:59
by minus the x mean part And that gets us
- 01:02
this table where we go from negative eight point eight
- 01:05
and the negative point eight and then point to and
- 01:07
on and on and on Okay And now we need
- 01:09
to square those results So that's the ex sabai minus
- 01:13
the actual apart and we get well negative eight point
- 01:16
Eight and they were just squaring this thing Seventy seven
- 01:18
point four and then zero point six Foreign point No
- 01:21
foreign seventeen twenty seven Now we some those values that's
- 01:25
the sigma part So we got seventy seven point four
- 01:28
four and then point six four point oh four seventeen
- 01:31
hundred all gets one twenty two point eight in total
- 01:34
all right time to divide the in minus one thing
- 01:36
into it which is well five minus one because that's
- 01:40
what the end value is or four so that's one
- 01:42
twenty two point eight divided by four that's about thirty
- 01:45
point seven All we have left now is a swift
- 01:48
square rooting toe pull out finally the last part of
- 01:51
it So what's the square root of thirty point seven
- 01:53
in texas that's about five point five four so our
- 01:56
signal or standard deviation is about five point five four
- 02:00
that's it The answer is c we are fully shmoop 00:02:03.53 --> [endTime] it on this one
Related Videos
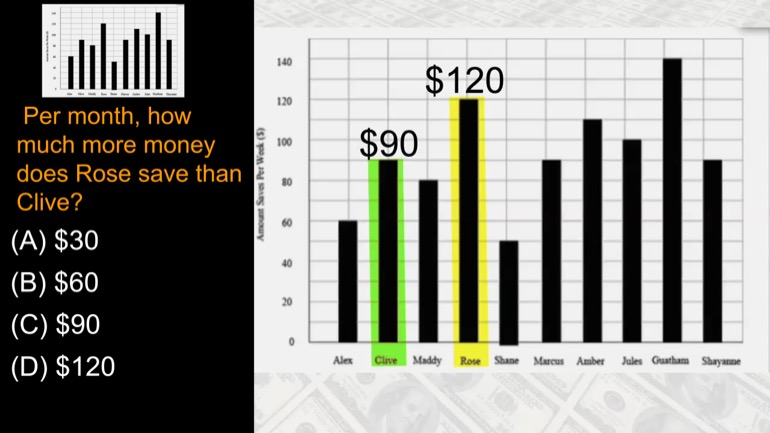
Per month, how much more money does Rose save than Olive?
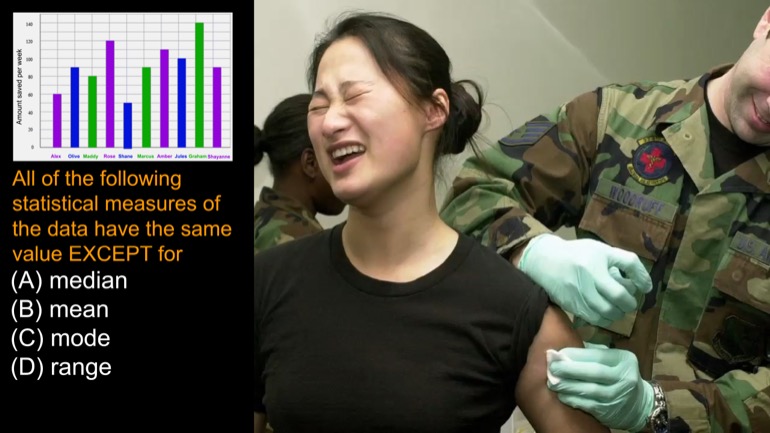
All of the following statistical measures of the data above have the same value EXCEPT for
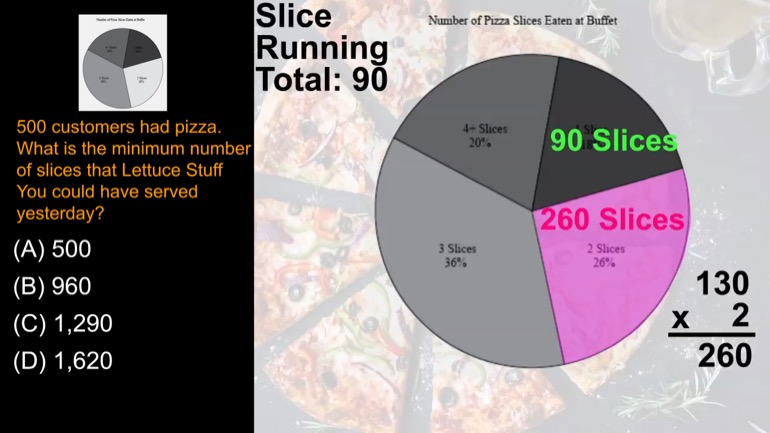
500 customers had pizza. What is the minimum number of slices that Lettuce Stuff You could have served yesterday?
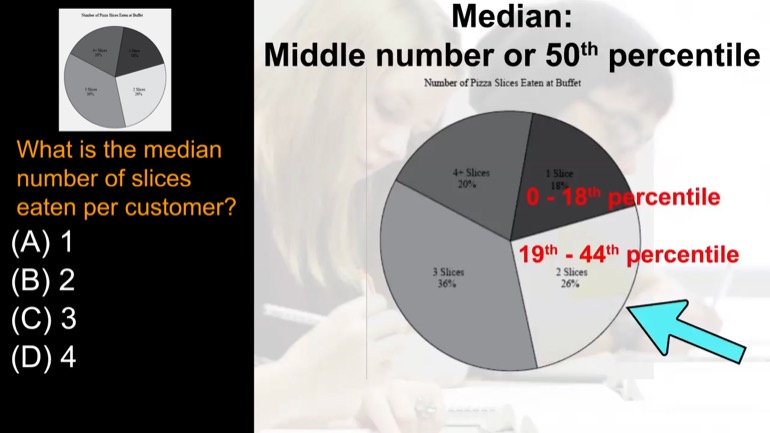
What is the median number of slices eaten per customer?
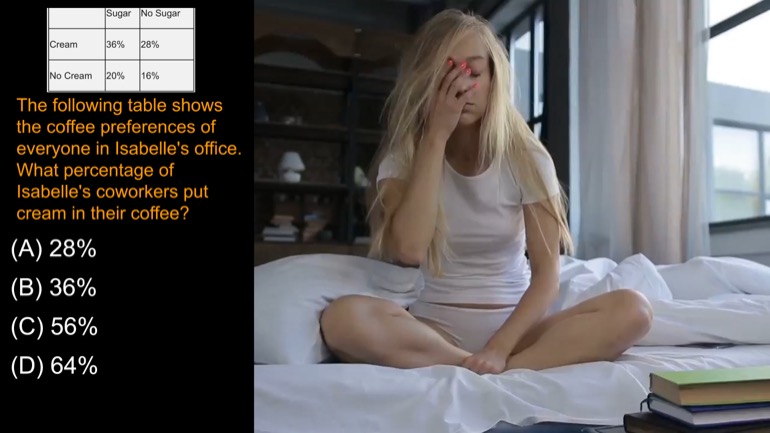
The following table shows the coffee preferences of everyone in Isabelle's office. What percentage of Isabelle's coworkers put cream in their coffee?