ShmoopTube
Where Monty Python meets your 10th grade teacher.
Search Thousands of Shmoop Videos
Interpreting Categorical and Quantitive Data Videos 17 videos


Data doesn't do us much good if we can't interpret it. Ever snuck into a CPA's office while he slips out for a coffee break and tried to decipher o...

Statistics, Data, and Probability I: Drill Set 3, Problem 4. How many different avatars can be created based on the given options?

Statistics, Data, and Probability I: Drill Set 3, Problem 5. What is the probability that the sum of the two rolls adds up to 9?
TSI Math: Reading Information on a Line Graph 26 Views
Share It!
Description:
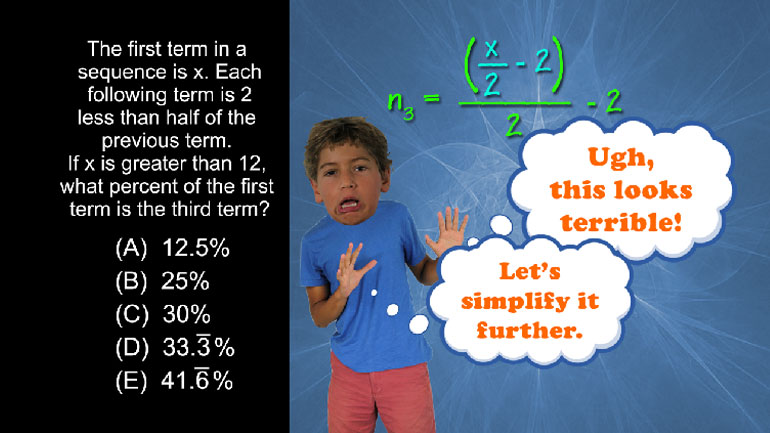
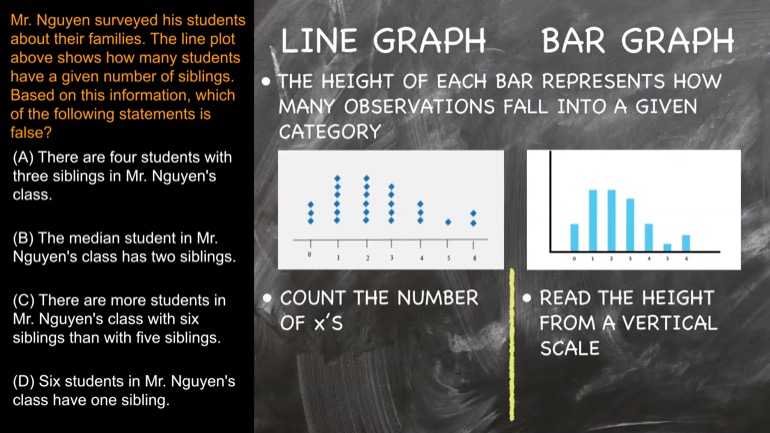
Mr. Nguyen surveyed his students about their families. The line plot above shows how many students have a given number of siblings. Based on this information, which of the following statements is false?
- Data Analysis, Statistics, and Probability / Interpreting Categorical and Quantitative Data
- Data Analysis, Statistics, and Probability / Interpreting Categorical and Quantitative Data
- TSI Math / Data Analysis, Statistics, and Probability
- Test Prep / TSI
- TSI Mathematics / Data Analysis, Statistics, and Probability
- TSI / TSI Math
- TSI / TSI Mathematics
- Test Prep / TSI
Transcript
- 00:02
Okay sy mash shmoop uppers We've got a chart here
- 00:04
for your number of siblings per student Wow the brady
- 00:08
bunch is way out here all right miss tring when
- 00:11
surveyed his students about their families the line plot above
- 00:14
shows how many students have a given number of siblings
Full Transcript
- 00:17
Based on this information which of the following statements is
- 00:21
balls Riri Well a line graph is a lot like
- 00:27
a bar graph The height of each bar represents the
- 00:30
number of observations that fall into a given category The
- 00:33
only difference is that we count the number of exes
- 00:35
instead of reading the height from a vertical scale Well
- 00:38
here there are five x is about three self Five
- 00:41
students have three siblings right So a is false If
- 00:46
there are four students with three siblings will know it
- 00:49
Sze wrong number there so is wrong We might trip
- 00:52
on his choice if we'd switch the meaning of the
- 00:54
lines and the exes There are three exes above four
- 00:57
which means that three students have four siblings not the
- 01:00
other way around So anyway whatever it's a more shmoop
Related Videos
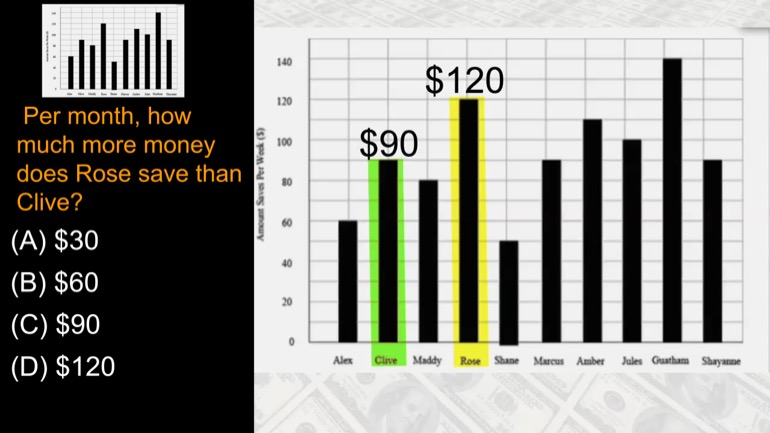
Per month, how much more money does Rose save than Olive?
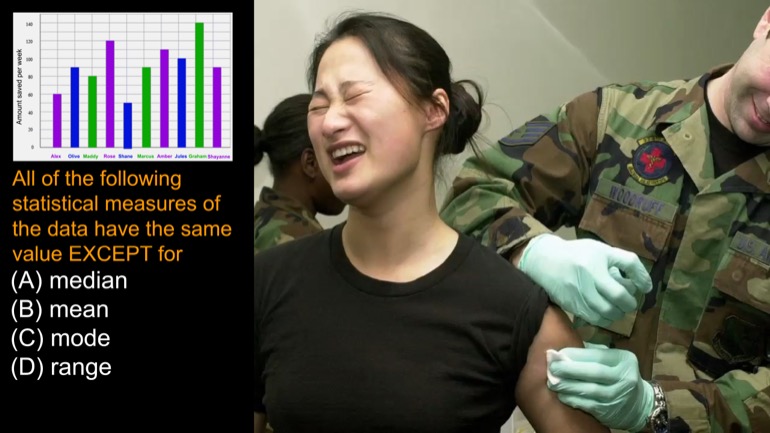
All of the following statistical measures of the data above have the same value EXCEPT for
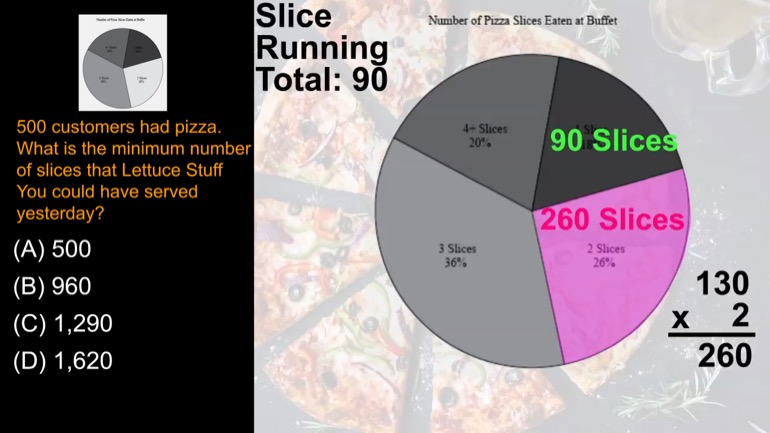
500 customers had pizza. What is the minimum number of slices that Lettuce Stuff You could have served yesterday?
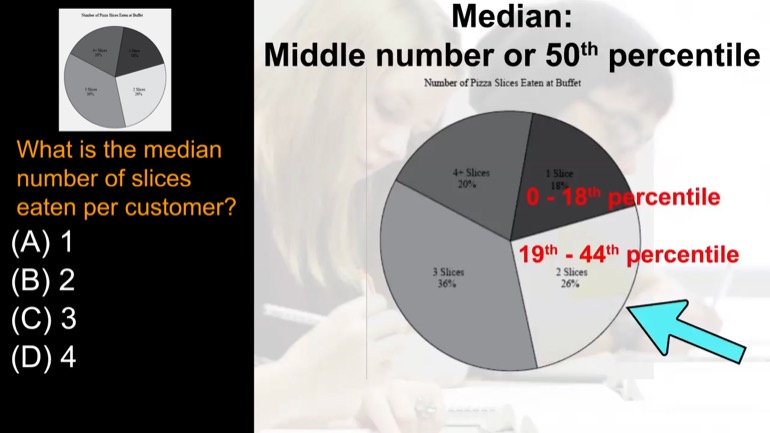
What is the median number of slices eaten per customer?
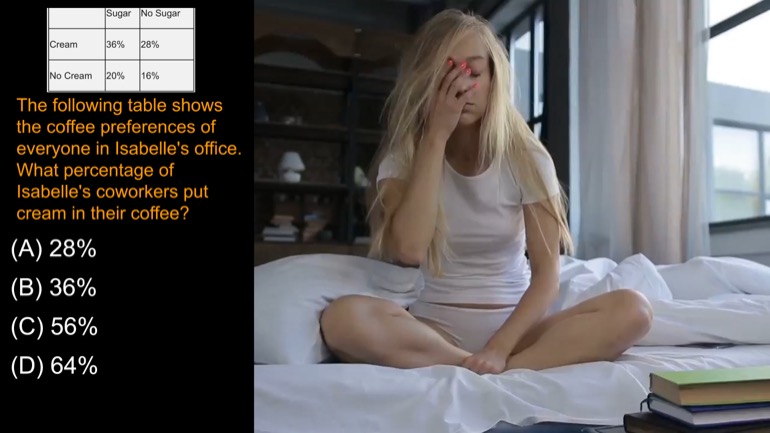
The following table shows the coffee preferences of everyone in Isabelle's office. What percentage of Isabelle's coworkers put cream in their coffee?