ShmoopTube
Where Monty Python meets your 10th grade teacher.
Search Thousands of Shmoop Videos
Interpreting Categorical and Quantitive Data Videos 17 videos


Data doesn't do us much good if we can't interpret it. Ever snuck into a CPA's office while he slips out for a coffee break and tried to decipher o...

Statistics, Data, and Probability I: Drill Set 3, Problem 4. How many different avatars can be created based on the given options?

Statistics, Data, and Probability I: Drill Set 3, Problem 5. What is the probability that the sum of the two rolls adds up to 9?
TSI Math: Which Data Set is Represented by a Box and Whisker Plot? 19 Views
Share It!
Description:
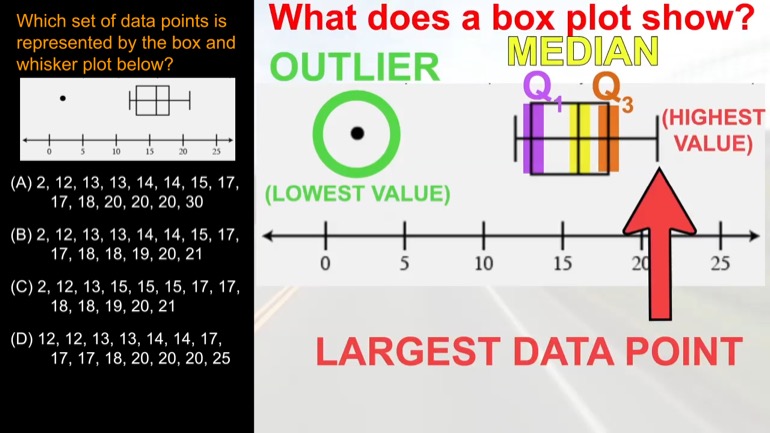
Which set of data points is represented by the box and whisker plot below?
- Data Analysis, Statistics, and Probability / Interpreting Categorical and Quantitative Data
- Data Analysis, Statistics, and Probability / Interpreting Categorical and Quantitative Data
- TSI Math / Data Analysis, Statistics, and Probability
- Test Prep / TSI
- TSI Mathematics / Data Analysis, Statistics, and Probability
- TSI / TSI Math
- TSI / TSI Mathematics
- Test Prep / TSI
Transcript
- 00:02
Okay t s i'ma shmoop er's Another boxy game for
- 00:05
you Look at this thing right here on the number
- 00:07
line which set of data points is represented by the
- 00:10
box and whisker plot below Okay well we're working backwards
- 00:20
here People check the rear view mirror and then shift
Full Transcript
- 00:22
into reverse If we want to figure out which data
- 00:24
set produced the given box plot we need to understand
- 00:28
what a box plot shows us first that dot all
- 00:31
by itself While that's an outlier in the data set
- 00:33
it should be one single value well away from the
- 00:36
other values on the box The line in the middle
- 00:39
is the median The left end of the boxes the
- 00:41
twenty fifth percentile or first quarter tile or simply kyu
- 00:45
won the right into the box is the seventh percentile
- 00:48
or the third quarter mile or q three Well that
- 00:51
little mark on the end there The left whisker is
- 00:54
normally the lowest point in the data set But due
- 00:57
to the outlier it'll be the second lowest value in
- 00:59
the data set Well the market the end of the
- 01:01
right whisker There is the largest data point So after
- 01:04
grabbing the magnifying glass we can see the outlier Is
- 01:07
it to the second lowest data point is twelve ish
- 01:10
and the first court tiles about thirteen Well the median
- 01:13
looks sixteen ish and well Let's see q three seems
- 01:16
to be hanging out around eighteen ish and the max
- 01:19
value is probably about what is that twenty one Well
- 01:22
we've got to data sets that have an outlier too
- 01:24
Second lowest point of twelve and a maximum value of
- 01:26
twenty one looks like we need to check the median
- 01:29
and other court tiles of those two sets to make
- 01:31
a choice to get our answer here So let's think
- 01:34
about this Got all these numbers here that they have
- 01:37
a median of sixteen Kyu won is thirteen Q three
- 01:41
is eighteen Well that fits the bill exactly So that's
- 01:45
it that's the set of data We want its answer
- 01:48
b and well we're boxing whiskers smoked on this one
Related Videos
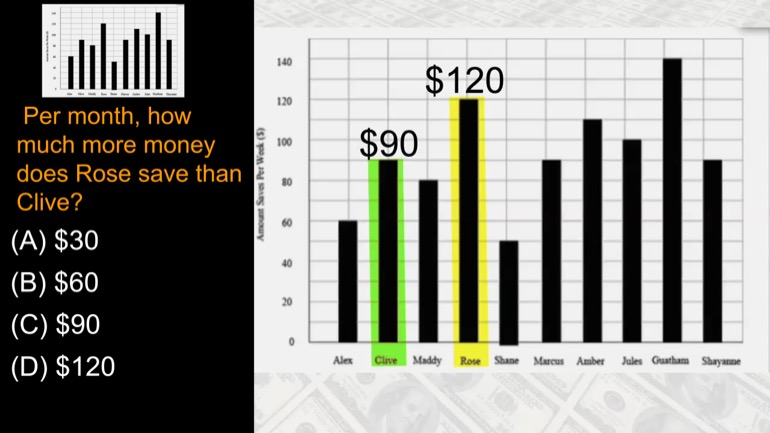
Per month, how much more money does Rose save than Olive?
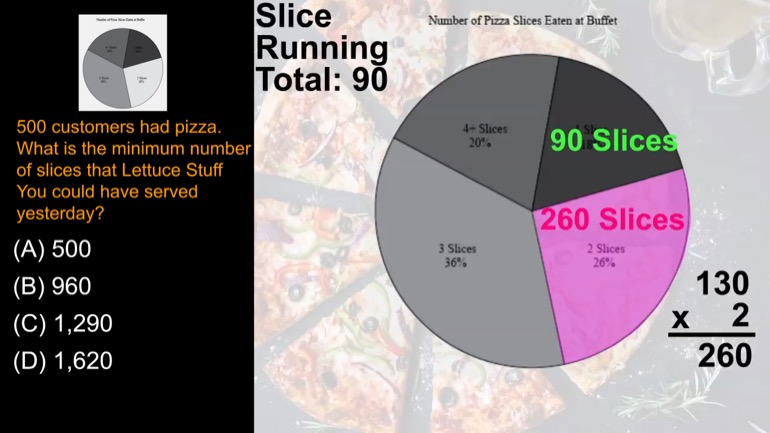
500 customers had pizza. What is the minimum number of slices that Lettuce Stuff You could have served yesterday?
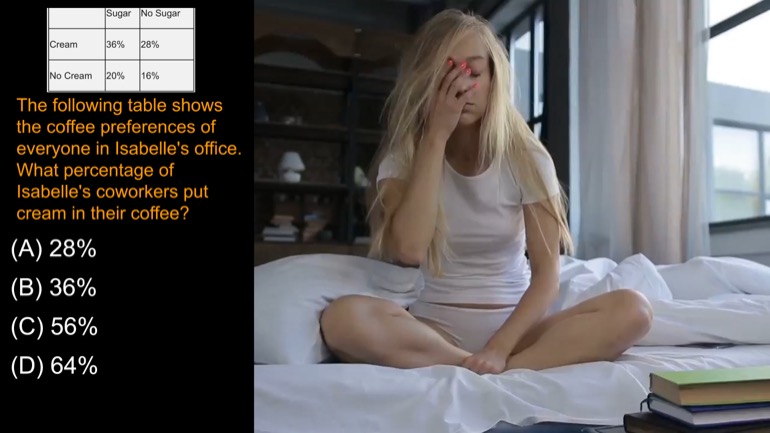
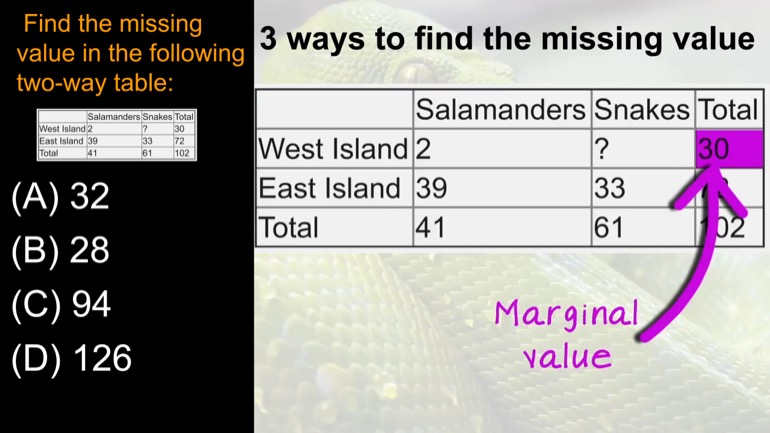
The following table shows the coffee preferences of everyone in Isabelle's office. What percentage of Isabelle's coworkers put cream in their coffee?
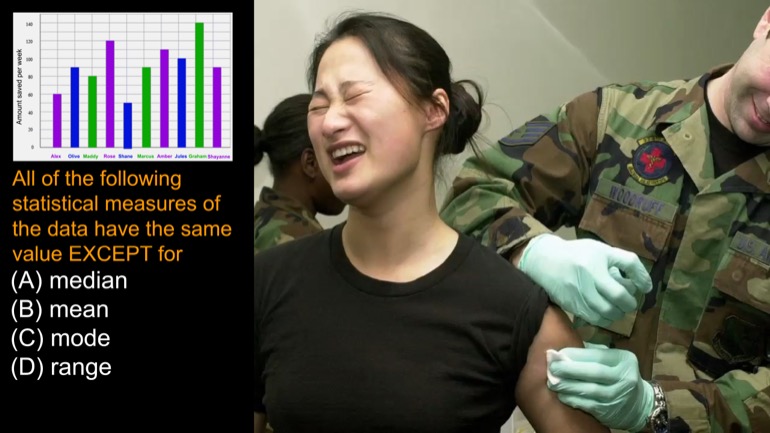
All of the following statistical measures of the data above have the same value EXCEPT for
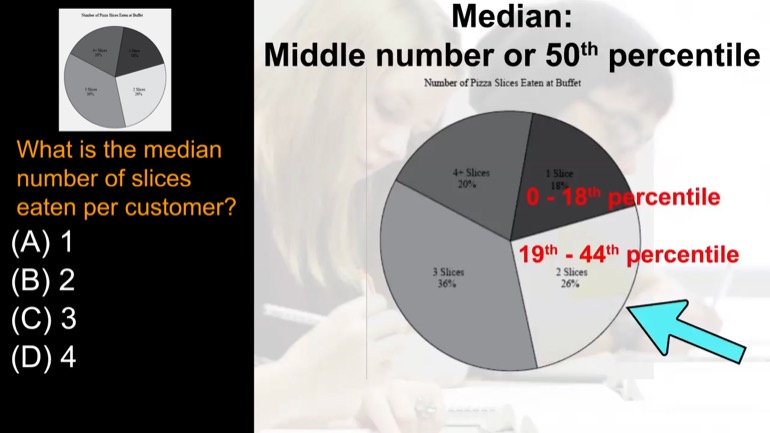
What is the median number of slices eaten per customer?