ShmoopTube
Where Monty Python meets your 10th grade teacher.
Search Thousands of Shmoop Videos
Interpreting Categorical and Quantitive Data Videos 17 videos


Data doesn't do us much good if we can't interpret it. Ever snuck into a CPA's office while he slips out for a coffee break and tried to decipher o...

Statistics, Data, and Probability I: Drill Set 3, Problem 4. How many different avatars can be created based on the given options?

Statistics, Data, and Probability I: Drill Set 3, Problem 5. What is the probability that the sum of the two rolls adds up to 9?
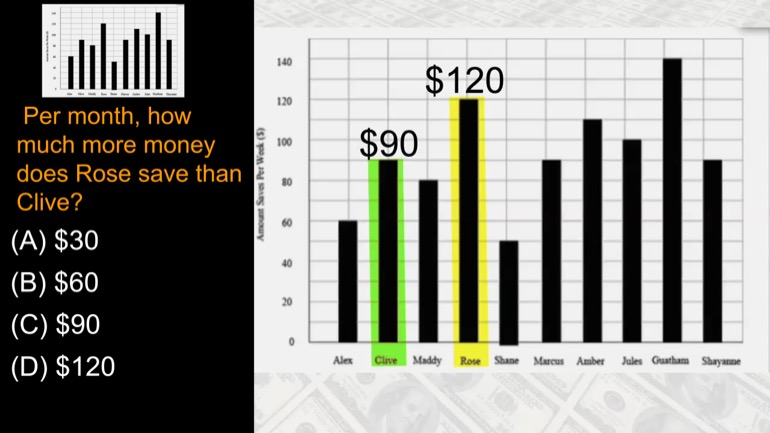
TSI Math: Reading a Graph to Calculate Moolah Saved 42 Views
Share It!
Description:
Per month, how much more money does Rose save than Olive?
- Data Analysis, Statistics, and Probability / Interpreting Categorical and Quantitative Data
- Data Analysis, Statistics, and Probability / Interpreting Categorical and Quantitative Data
- TSI Math / Data Analysis, Statistics, and Probability
- Test Prep / TSI
- TSI Mathematics / Data Analysis, Statistics, and Probability
- TSI / TSI Math
- TSI / TSI Mathematics
- Test Prep / TSI
Transcript
- 00:02
Okay sy mash from upper people You were interpreting categorical
- 00:06
and quantitative data statistical measures and having a lot of
- 00:09
fun doing it That's Just getting okay Well check this
- 00:12
out The bar graph below shows how much each person
- 00:14
in a group of friends saves per week Use this
Full Transcript
- 00:18
information Answer questions One two All right per month How
- 00:22
much more money does rose save it then clive Well
- 00:29
why is money called doe people because everyone needs it
- 00:34
Everyone needs to save it to rose six hundred twenty
- 00:36
bucks every week and clive saved ninety dollars every week
- 00:40
each week Rose save one hundred twenty minus ninety thirty
- 00:43
dollars more than clive because well there are four weeks
- 00:46
in a month So rose saves four times thirty dollars
- 00:49
or one hundred twenty dollars more than clive every month
- 00:52
All right and that's it The answer is d one 00:00:54.501 --> [endTime] hundred twenty bucks were shmoop
Related Videos
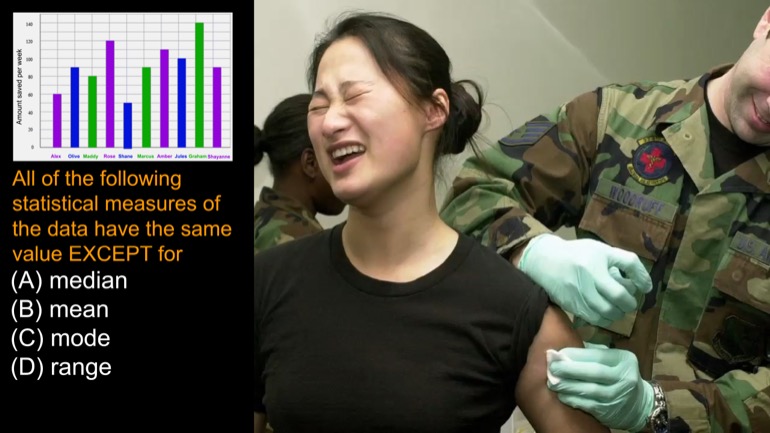
All of the following statistical measures of the data above have the same value EXCEPT for
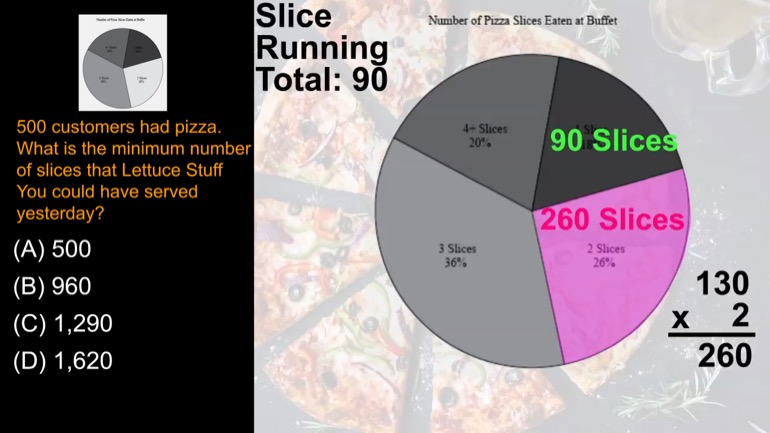
500 customers had pizza. What is the minimum number of slices that Lettuce Stuff You could have served yesterday?
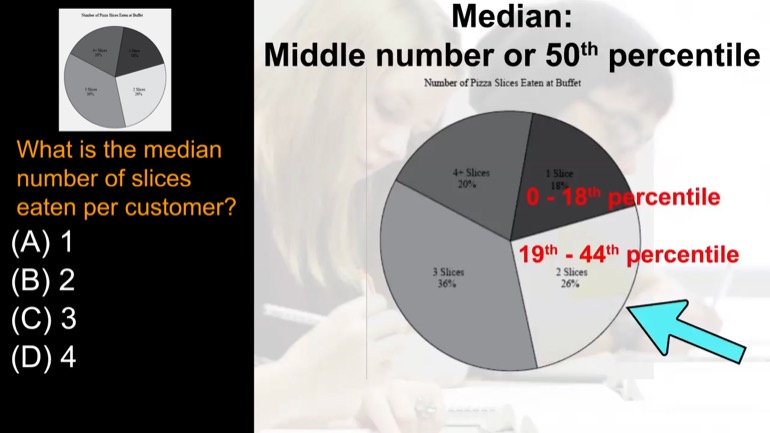
What is the median number of slices eaten per customer?

The following table shows the coffee preferences of everyone in Isabelle's office. What percentage of Isabelle's coworkers put cream in their coffee?

Each minute of studying increased Wendy's quiz grade by approximately how many points?